Clinical Graphs

Clinical Graphs

Data Visualization
Sanjay Matange 0
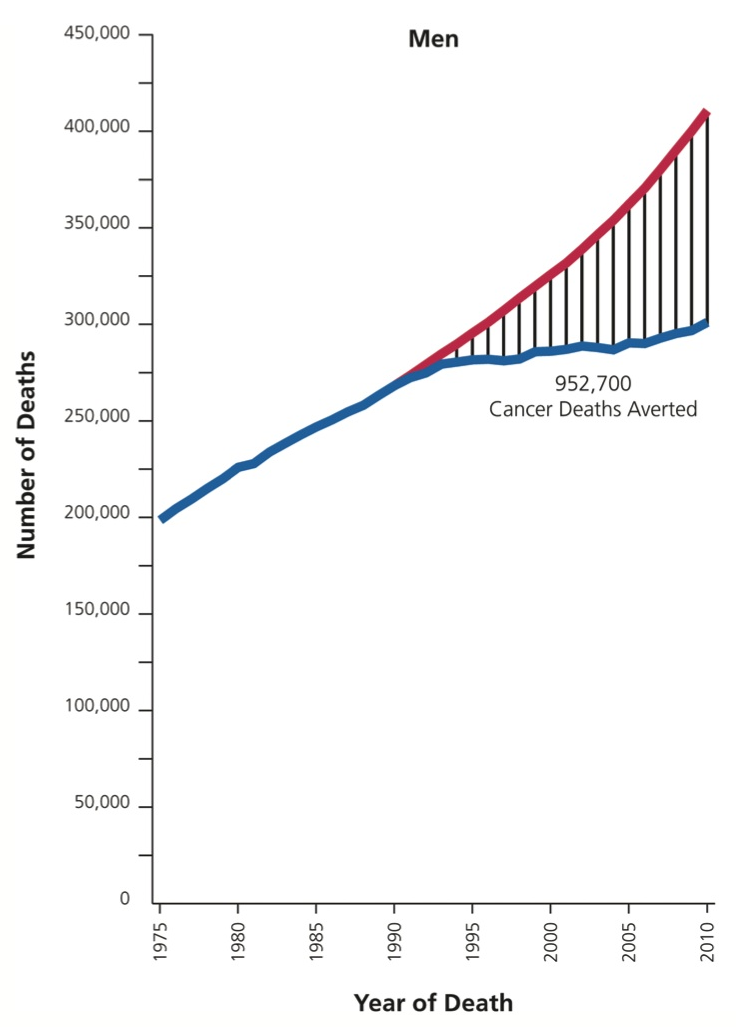
Cancer Deaths Averted

Significant progress in reduction of Cancer mortality is shown in a graph that I noticed recently on the Cancer Network web site.  This graph showed the actual and projected cancer mortality by year for males.  The graph is shown on the right. The graph plots the projected and actual numbers

Data Visualization
Sanjay Matange 0
Clinical Graphs

This week I had the opportunity to present a 1/2 day seminar on creating clinical graphs using the SG procedures during an In-House SAS Users' group meeting.  I have presented this seminar quite a few times now, and I always learn something. The audience was very receptive, with some people

Data Visualization
Sanjay Matange 0
PharmaSUG-China 2014

The Third PharmaSUG-China conference was held in Beijing last week, and I had the pleasure to attend this excellent conference along with a record number of attendees. On Thursday, I presented two 1/2 day seminars on ODS Graphics.  One titled "Advanced Topics in GTL" and another titled "Complex Clinical Graphs

1 9 10 11 12 13 14