Basic ODS Graphics: Axis Tables

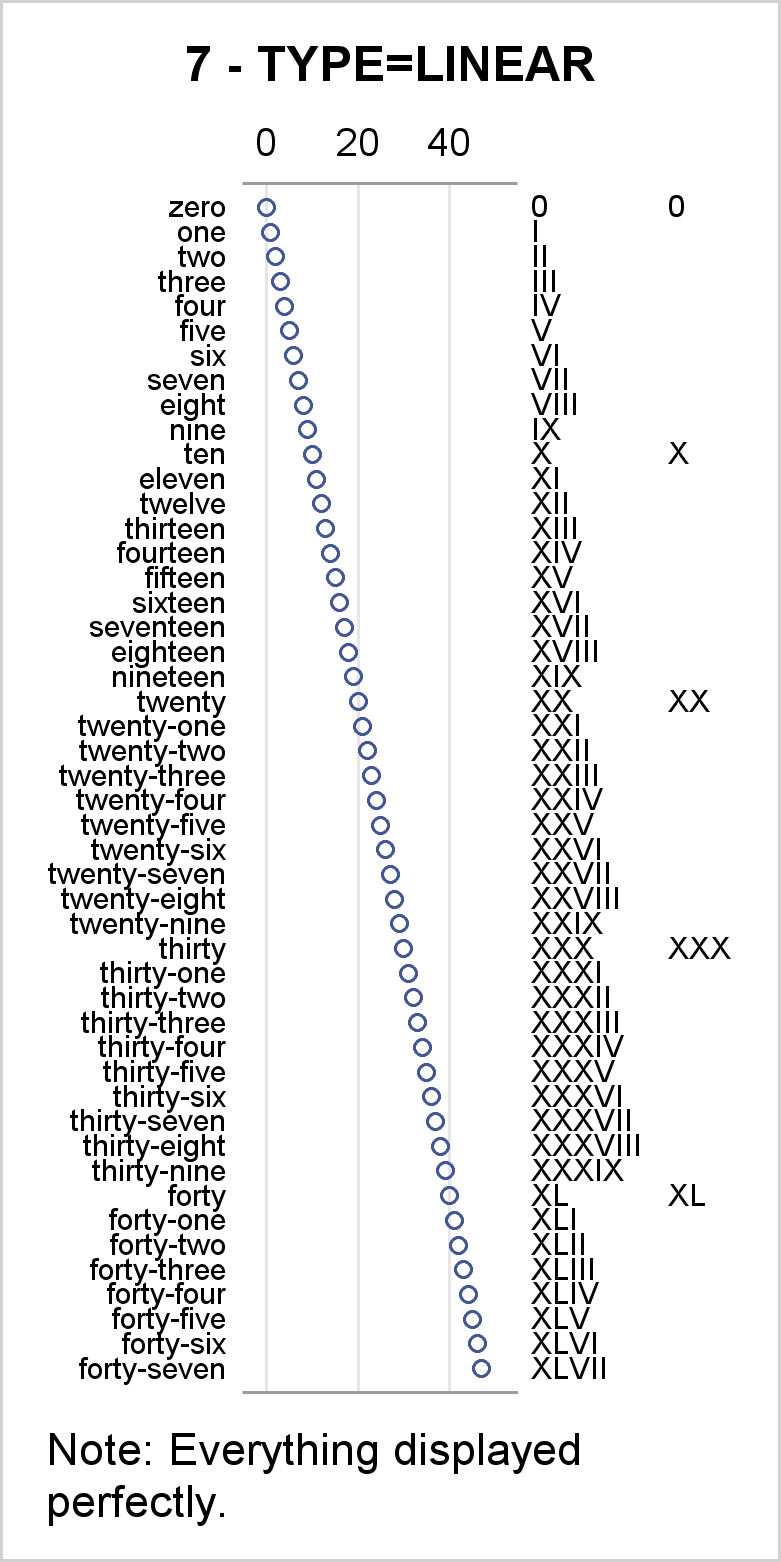
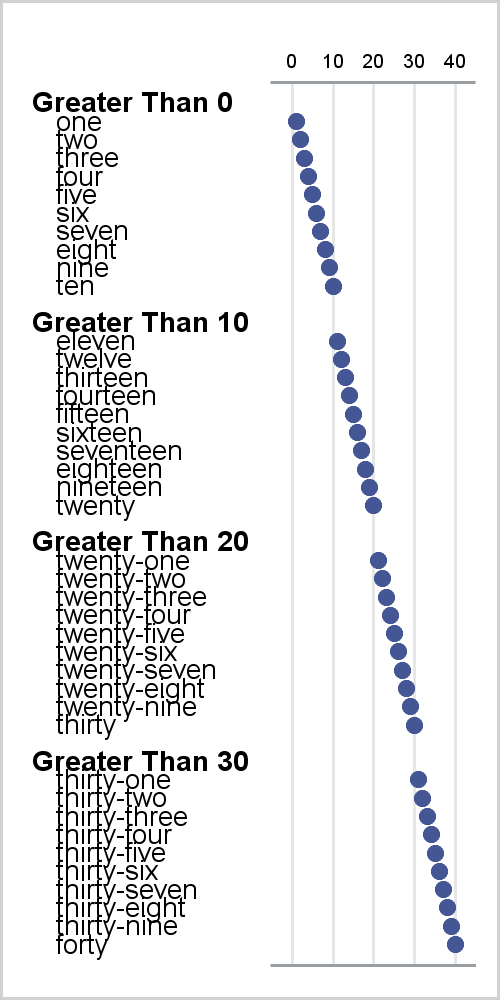
I review some fundamental principles of creating axis tables along with graphs that have TYPE=LINEAR or TYPE=DISCRETE axes.

Warren F. Kuhfeld is a distinguished research statistician developer in SAS/STAT R&D. He received his PhD in psychometrics from UNC Chapel Hill in 1985 and joined SAS in 1987. He has used SAS since 1979 and has developed SAS procedures since 1984. Warren wrote the SAS/STAT documentation chapters "Using the Output Delivery System," "Statistical Graphics Using ODS," "ODS Graphics Template Modification," and "Customizing the Kaplan-Meier Survival Plot." He also wrote the free web books Basic ODS Graphics Examples and Advanced ODS Graphics Examples.
I review some fundamental principles of creating axis tables along with graphs that have TYPE=LINEAR or TYPE=DISCRETE axes.
Axis tables enable you to combine tabular and graphical information into a single display. I love axis tables. My involvement with axis tables dates back over 30 years to their ancient predecessor, the table that contains an ASCII bar chart. In the mid 1980s, I created a table in PROC
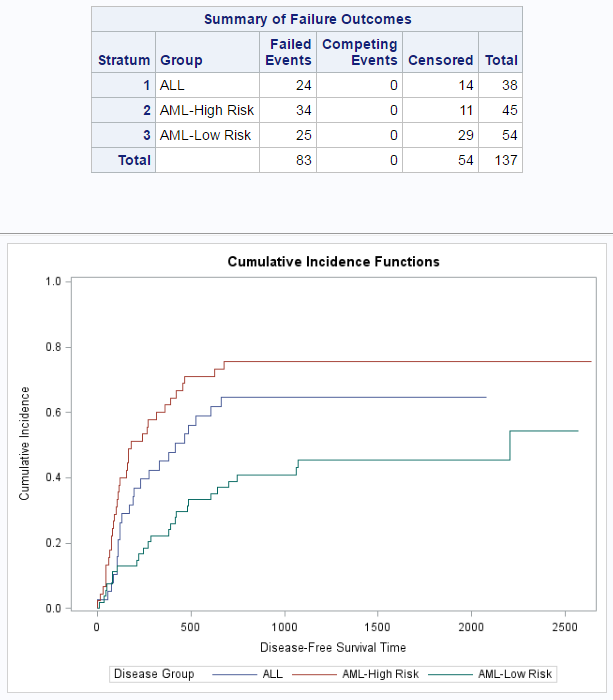
In my previous post, I showed you how to change the titles in graphs produced by analytical procedures; today I will show you how to remove subtitles that procedures display on some output pages. The following step creates output that contains a SAS title ('Illustrate the CIF Plot'), a PROCTITLE