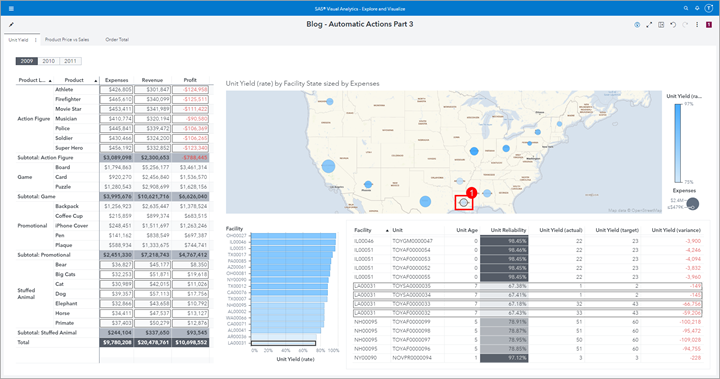
If you haven't explored data with Automatic Actions enabled yet, then read on to learn about some fast and easy ways to gain insights using One-way filters, Two-way filters or Linked Selection! Part 1 – Easy exploration for multiple data sources In this post, we focus on One-way filters. Here
Author
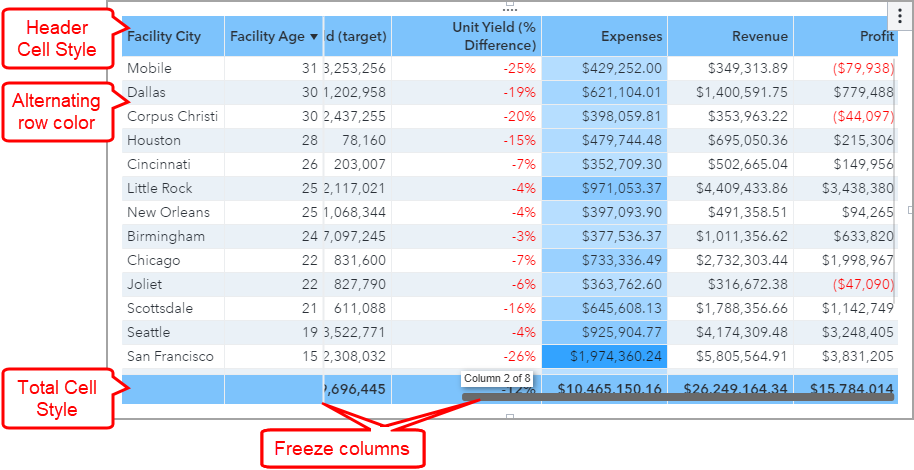
The List Table can be more than just a black-and-white ledger style visual. There are many other enhancements such as alternating row colors, abbreviated values, display rules, etc.
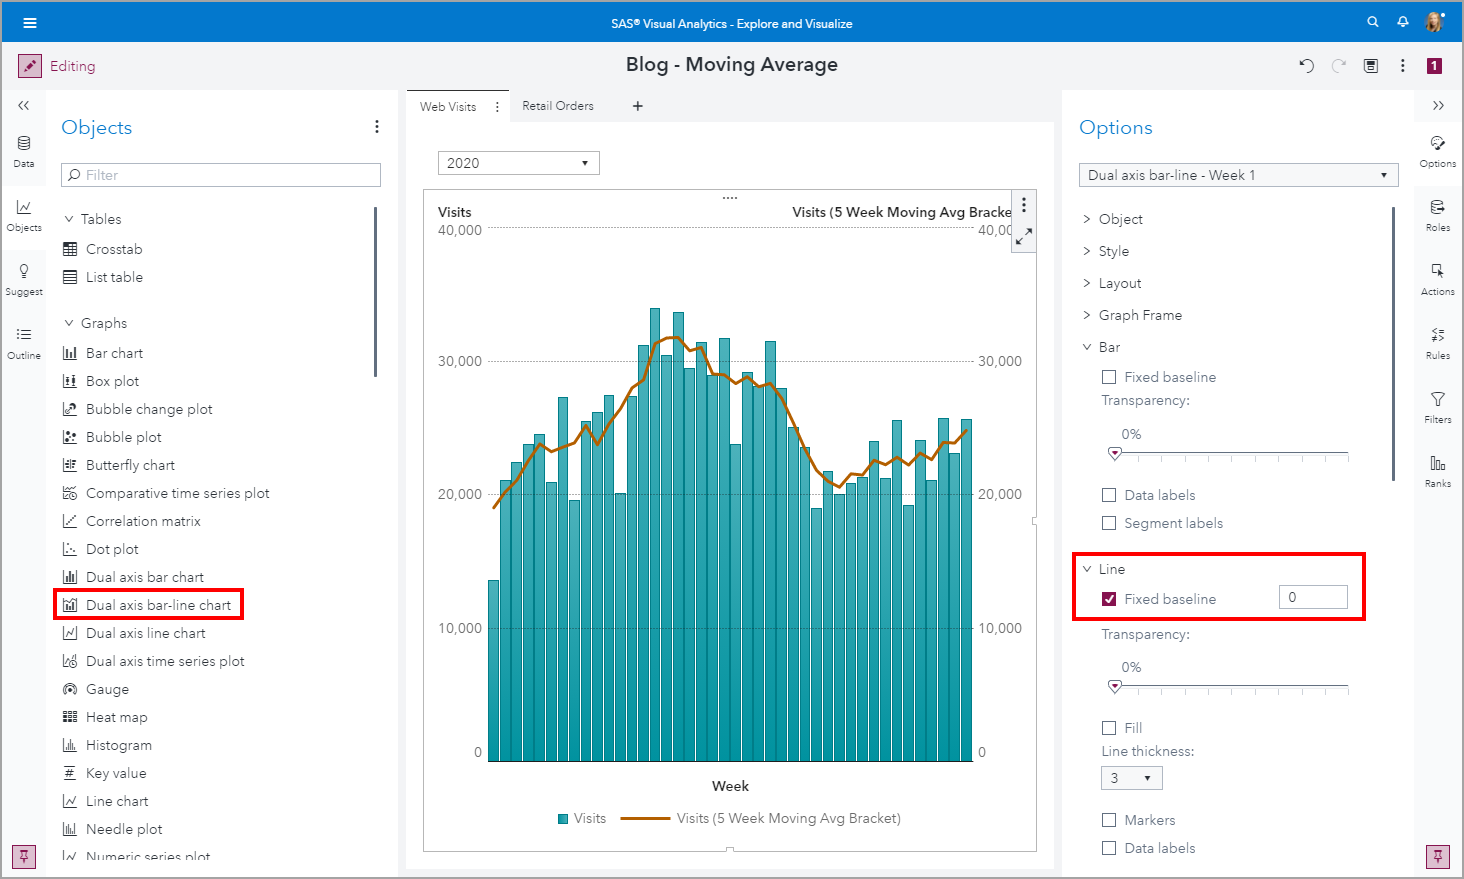
Data visualization has never been more widespread and consumed by a global audience as it has been this year with the Coronavirus pandemic. One visualization that is commonly used to display metrics of Coronavirus is a bar line chart where the bars display the actual values and the line is a moving average metric.
Let's learn how to prompt for a date range in a SAS Visual Analytics report using control objects such as sliders, drop-down lists, and text input.
Common filters are filters that can be shared between objects in your reports. Common filter benefits include 1) Easy to assign the same filter conditions to other report objects, 2) When you edit a common filter, it is updated everywhere that the common filter is used, and 3) A common filter is available for the entire report, across pages.
Introduced in the SAS Visual Analytics 8.4 release is the ability to control the layout position of these prompts. Using my example report, let’s change the placement of these prompts.
In SAS Visual Analytics 8.3, a Data View is a reusable and shareable template for a data source. That means that the data view is tied to the data source, and not to the report. Here's how to use them.
Introduced with Visual Analytics 8.2 is a new object named: Key Value. The intent of this object is call attention to an aggregated value for a measure, a category, or both. In this post you'll learn more about working with the Key Value Object in SAS Visual Analytics.
You will not find an object in SAS Visual Analytics named Dynamic Text. Instead, you will find a Text object that allows you to insert dynamically driven data items. By using the Text object’s dynamic capabilities you can build custom report titles, object titles, emphasize measures and even supply the last modified time of the data source in your SAS Visual Analytics Report. In this post, I will outline the ways how you can leverage Dynamic Text in a SAS Visual Analytics Report.
SAS Visual Analytics 8.2 introduces the Hidden Data Role. This role can accept one or more category or date data items which will be included in the query results but will not be displayed with the object. You can use this Hidden Data Role in: Mapping Data Sources. Color-Mapped Display
Another report requirement came my way and I wanted to share how to use our Visual Analytics’ out-of-the-box relative period calculations to solve it. Essentially, we had a customer who wanted to see a metric for every month, the previous month’s value next to it, and lastly the difference between
SAS Visual Analytics 7.4 has added the support for date parameters. Recall from my first post, Using parameters in SAS Visual Analytics, a parameter is a variable whose value can be changed at any time by the report viewer and referenced by other report objects. These objects can be a
In a previous blog, I describe how there are a few new features related to report and page prompts in SAS Visual Analytics 8.1; namely the ability to configure cascading prompts in VA 8.1: Cascading Prompts as Report and Page Prompts. In this blog, I will cover how to configure prompts, either
There are several exciting new features available in SAS Visual Analytics 8.1 that I know will excite you; this blog will show you how you can now configure cascading prompts for the Report Prompt and Page Prompt areas! Prior to SAS Visual Analytics 8.1 there was a way to use parameters to configure cascading prompts for
You may be wondering if you need something special to gain access to the Schedule Chart object. Don’t worry, you don’t, you just need to unhide this visualization if it isn’t already. You can do this from the Objects’ drop down menu. There are several other objects available to you
In this post I wanted to shed some light on a visualization you may not be using enough: the Word Cloud. Word association exercises can often be a fun way to pass the time with friends, or it can trigger immediate action – just think of your email inbox and
If your SAS Visual Analytics report requirements include linking out to separate reports without the need to pass values, you may want to consider using images to enhance the appearance of your base report. Here are three style examples using images that you can use depending on your report design
Requirements that are the most easily described can often be the most difficult to implement. I’m referring to requests like: Display a gauge with the most recently collected metric. Plot a 18 month rolling window of profit. Display last month’s products percent of total metrics for visual comparison. Okay, so
For many people, building something from scratch, no matter how simple or complex, is fascinating. That’s why programs similar to How’s It Made are so appealing and, for me, addicting. And thus, the inspiration for this blog; I will walk you through building a set of graphs and how to
Reference lines on a visualization are used to help identify goals or targets, acceptable or unacceptable ranges, etc; basically any metric that puts a frame of reference around the values on the visualization. The Percent of Total of a metric is used to help identify a part-to-whole relationship. It answers
Pick your category? If this title seems familiar, that’s because in my last blog, Use parameters to pick your metric in VA Reports, I covered how to use parameters to allow your users to pick which metric they want to view in their visualizations. This is a great technique that
Look at the report below. Imagine being asked to allow your users to select which Measure, highlighted in yellow, they are looking at: Income, Expense or Profit. This is a frequent report requirement and I’m going to outline just one of the ways you can design your report to satisfy
The SAS Visual Analytics 7.2 release introduced context sensitive URLs for VA reports which means we can now directly pass parameter values in the URLs! This opens the door and allows for greater flexibility when needing to use a URL to access a VA report. One use would be if
The SAS Visual Analytics 7.2 release introduces a new look and feel to the Hub with the modern (HTML5) version. It also introduces a new feature, Shared Collections, which allows an administrator to push a Shared Collection to all users’ Hub view, including Guest access. And bonus - it will
Do you support a multilingual reporting audience? This is a fast-growing requirement for many of you, and now your SAS Visual Analytics reports can be easily configured to support any number of languages. From SAS Visual Analytics Designer, there is an option under the File menu called Localize Report. This
An Info Window is a SAS Visual Analytics pop-up window that provides additional information when a user selects a report object. When designing your report, you can think of an Info Window as simply an additional report section that is defined as hidden. Now that you know what an Info
Does your week start on Sunday or Monday? Do you have a promotional product you would like to see at the top of your list? Do you have a particular order in which you like to view your regions? Custom sorting is now possible with SAS Visual Analytics 7.1. The
In the latest release of SAS Visual Analytics Designer, a parameter is a variable whose value can be changed and that can be referenced by other report objects. Why is this an important introduction? This addition means that, not only can you design interactive reports via prompt controls, those controls
Report design includes several phases. Granted, these phases aren’t official: they’re more a reflection of my own thought processes and how my report designs typically unfold: the initial “get the data on the screen to see what we have” phase the addition of filters and prompts to assist with guided