In one of my prior posts, I discussed the power behind a Hidden Data Role in SAS Visual Analytics. In this post, I provide a summary of places you can go to learn more about other enhancements to the List Table.
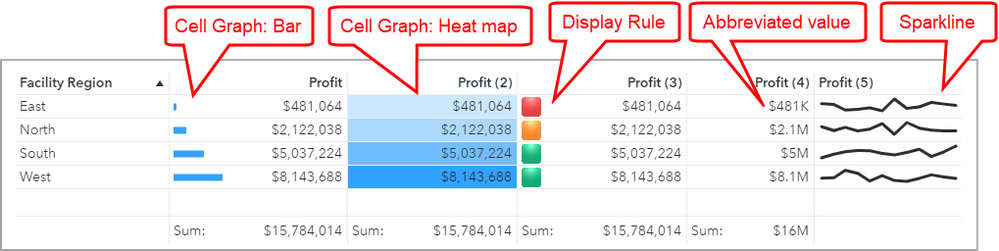
The List Table can be more than just a black-and-white ledger style visual. Here is one example where I’ve highlighted some of the enhancements you can apply to the List Table:
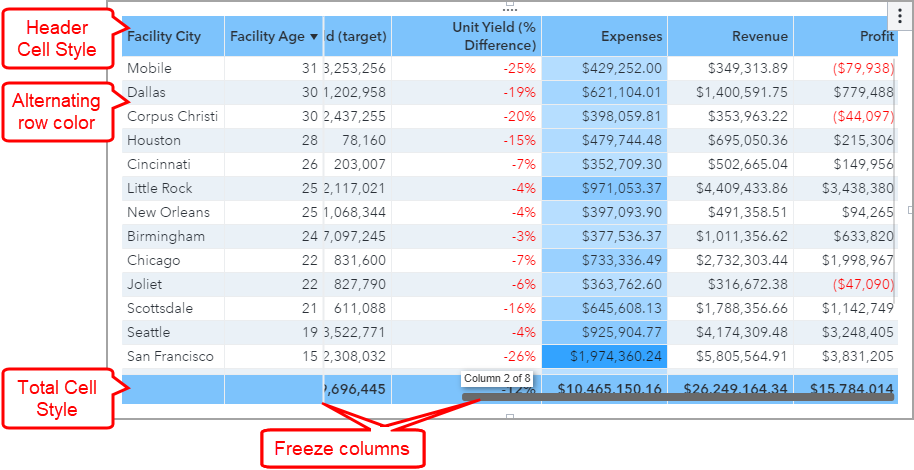
You can also control the styling of the List Table by changing the header and total cell background colors as well as an alternating row color:
If you want to style your List Table for all users to have the same color scheme and other style enhancements, consider using either a Report Theme or Object Templates for consistency across report developers.
Want to learn more? The SAS Communities version of this article provides examples of:
- Display Rules: Color-Mapped, Expression or Gauge
- Abbreviated value
- Sparkline
- Totals
- Freeze Columns to the left
You can also learn more about Cell Graphs by reading the article, Use SAS Visual Analytics 8.3 Cell Graphs to enhance List Tables and Crosstabs, or by checking out this video:
