Author

Sanjay Matange
RSS
Director, R&D

Sanjay Matange is R&D Director in the Data Visualization Division responsible for the development and support of the ODS Graphics system, including the Graph Template Language (GTL), Statistical Graphics (SG) procedures, ODS Graphics Designer and related software. Sanjay has co-authored a book on SG Procedures with SAS/PRESS.

Data Visualization
Sanjay Matange 0
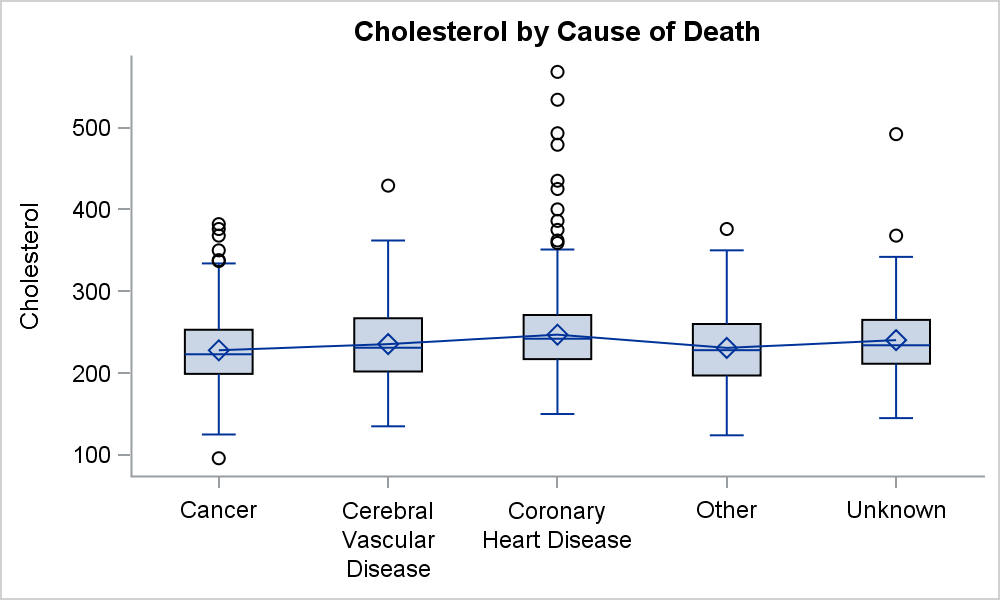
Boxplot with connect

This blog post is motivated by a post by a user on the communities page about creating a box plot with colored boxes by category and multiple connect lines. Normally, a box plot can be drawn by category, with a single connect line for one of the statistical values of

1 34 35 36 37 38 100