Author

Sanjay Matange
RSS
Director, R&D

Sanjay Matange is R&D Director in the Data Visualization Division responsible for the development and support of the ODS Graphics system, including the Graph Template Language (GTL), Statistical Graphics (SG) procedures, ODS Graphics Designer and related software. Sanjay has co-authored a book on SG Procedures with SAS/PRESS.

Data Visualization
Sanjay Matange 0
Legendary

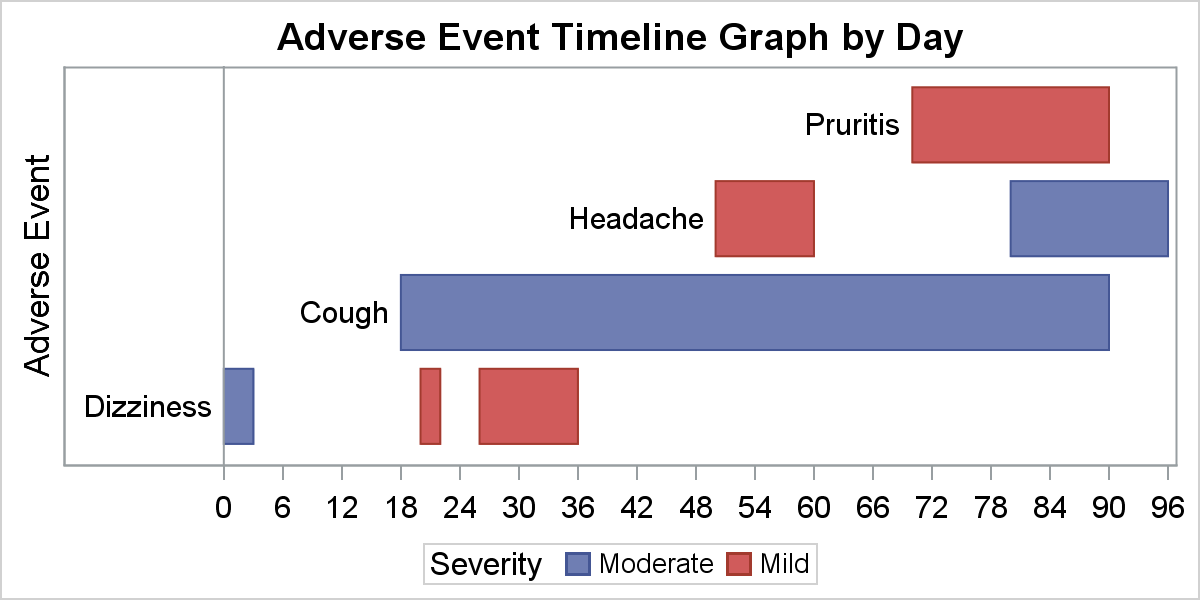
Entries in a legend are populated automatically based on the data.  When creating a graph with group classification,  the display attributes for each bar are derived from the GraphData1-12 style elements from the active style. The graph on the right shows you the result of creating an adverse event timeline

1 32 33 34 35 36 100