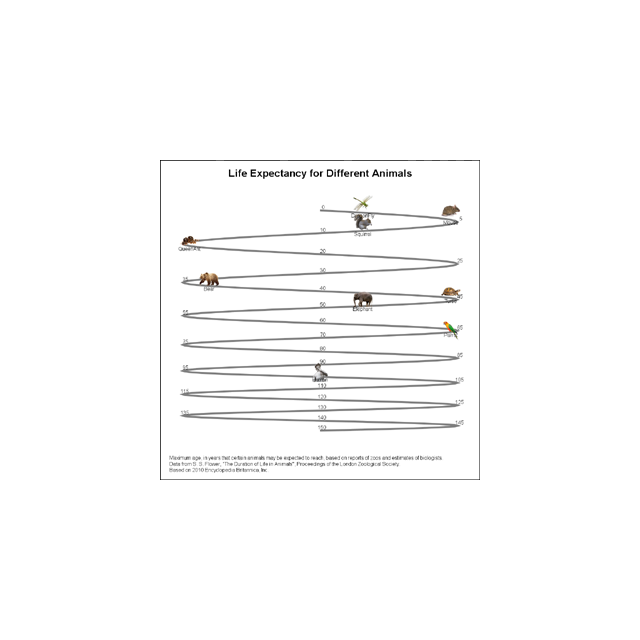
Animal life expectancy graph

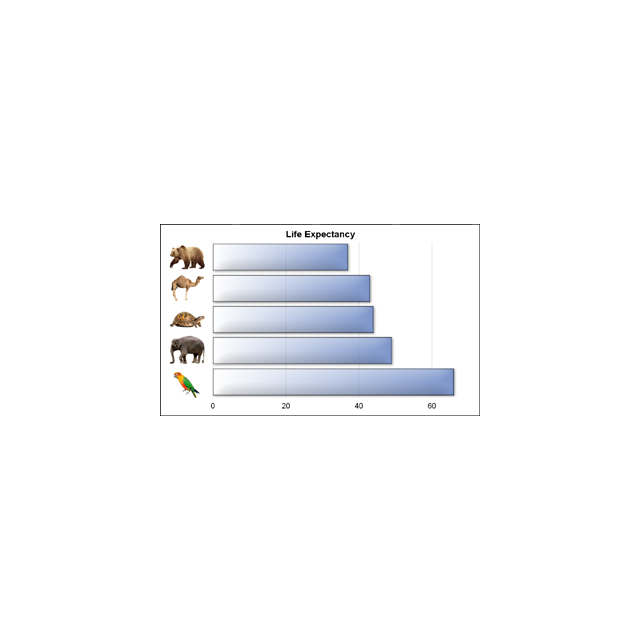
Last week I published an article on creating bar charts with visual category values. The idea was to use visual icons for the category values in a HBAR of age by animal. For the data, I referred to a visual from the 2010 Encyclopedia Britannica Inc. that I found on the