Suppress variable labels in SAS procedures

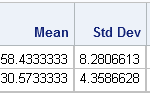
Sometimes a small option can make a big difference. Last week I thought to myself, "I wish there were an option that prevents variable labels from appearing in a table or graph." Well, it turns out that there is! I was using PROC MEANS to display some summary statistics, and