Author

Rick Wicklin
RSS
Distinguished Researcher in Computational Statistics

Rick Wicklin, PhD, is a distinguished researcher in computational statistics at SAS and is a principal developer of SAS/IML software. His areas of expertise include computational statistics, simulation, statistical graphics, and modern methods in statistical data analysis. Rick is author of the books Statistical Programming with SAS/IML Software and Simulating Data with SAS.

Rick Wicklin 0
How to specify mosaic plot colors in SAS

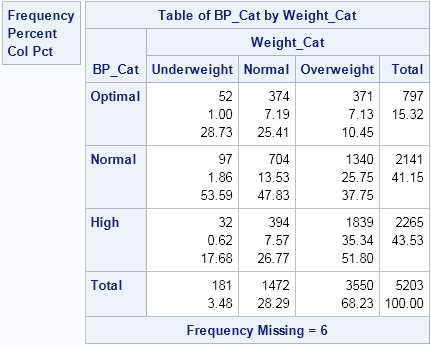
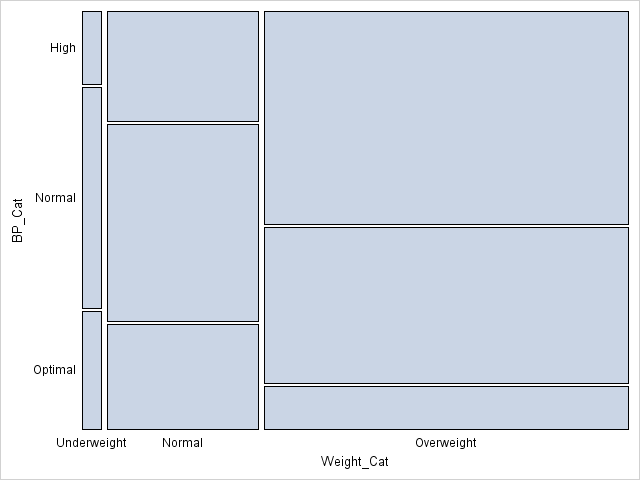
The mosaic plot is a graphical visualization of a frequency table. In a previous post, I showed how to use the FREQ procedure to create a mosaic plot. This article shows how to create a mosaic plot by using the MOSAICPARM statement in the graph template language (GTL). (The MOSAICPARM

Rick Wicklin 0
Create mosaic plots in SAS by using PROC FREQ

Mosaic plots (Hartigan and Kleiner, 1981; Friendly, 1994, JASA) are used for exploratory data analysis of categorical data. Mosaic plots have been available for decades in SAS products such as JMP, SAS/INSIGHT, and SAS/IML Studio. However, not all SAS customers have access to these specialized products, so I am pleased

1 392 393 394 395 396 540