How to draw a Mandelbrot set in SAS Visual Analytics

Cindy Wang's curiosity about the Mandelbrot set led her to draw one using SAS Visual Analytics.

Cindy Wang is a manager at SAS Beijing R&D. She leads her team in ensuring the software quality of SAS® Business Intelligence and SAS® Visual Analytics products. Her expertise includes data visualization, business intelligence and visual analytics. A problem solver, Cindy has rich experience in business analytical applications and technical support. Passionate about educating the next generation of SAS users, she has delivered several very well-received educational lectures on visual analytics at Peking University and Tsinghua University.
Cindy Wang's curiosity about the Mandelbrot set led her to draw one using SAS Visual Analytics.
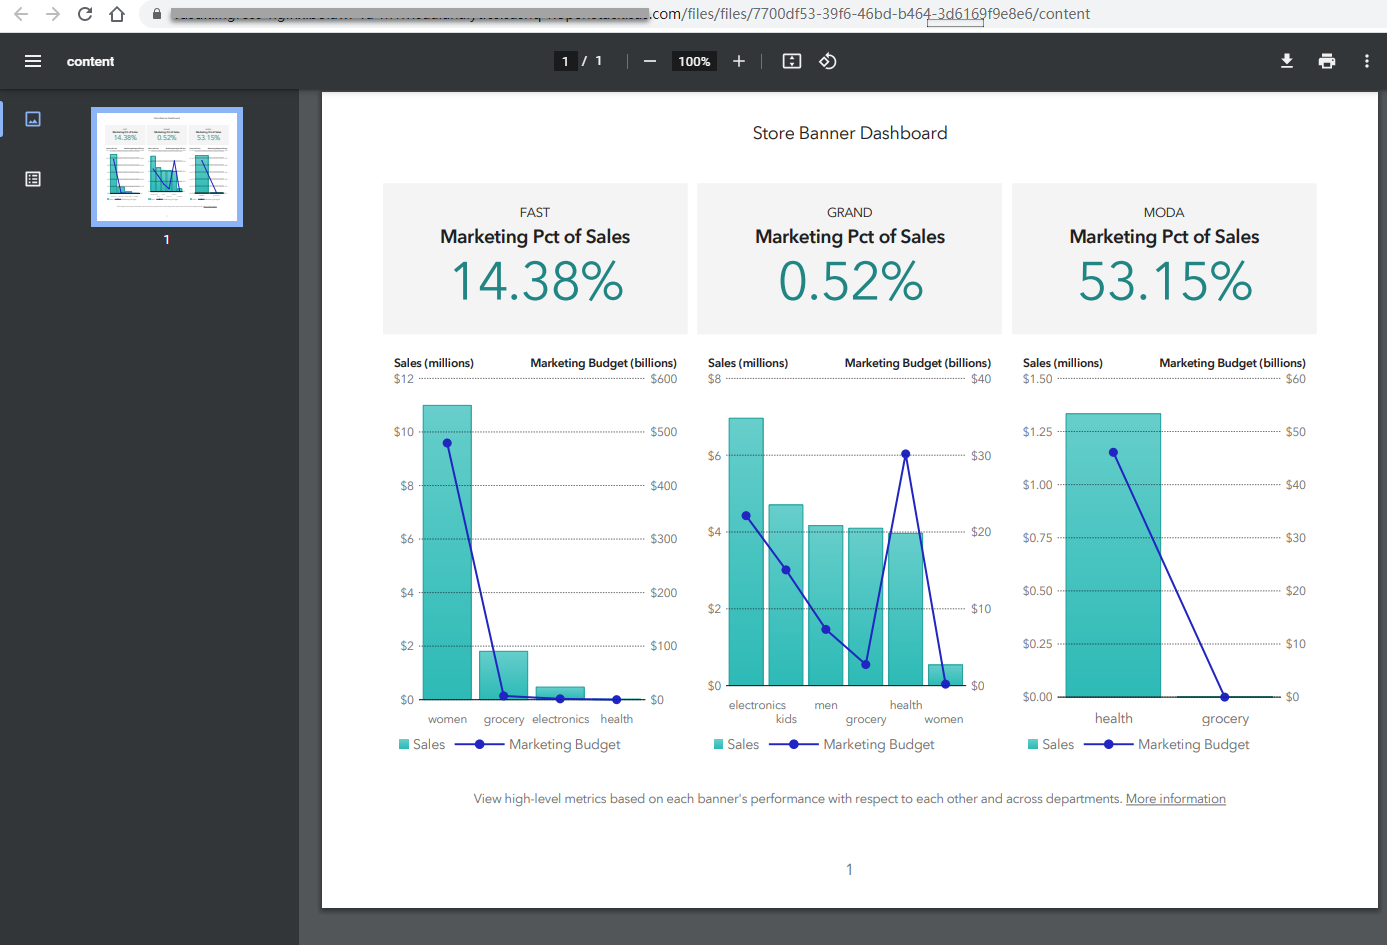
Readers of my earlier post Discover Visual Analytics Report Paths with REST APIs asked for ways to export SAS Visual Analytics (VA) report content programmatically. I know this is a topic of interest from many VA report designers. So, I think it’s better to write something on this and I
There are three types of visualization APIs defined in the SAS Viya REST API reference documetation: Reports, Report Images and Report Transforms. You may have seen the posts on how to use Reports and Report Images. In this post, I'm going to show you how to use the Report Transforms