Tag: Keylegend

Data Visualization
Sanjay Matange 0
Box plot legend

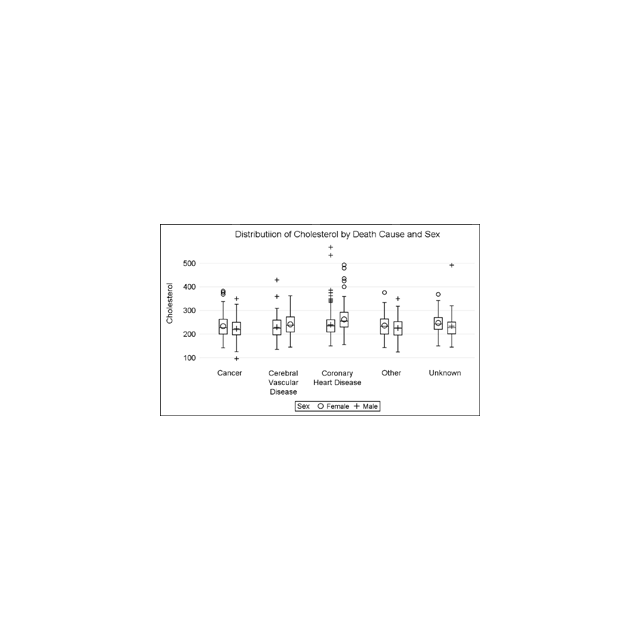
A grouped box plot created by SGPLOT VBOX / HBOX statement or GTL BOXPLOT statement will display groups within categories using group colors and puts the color swatches representing the group values in the legend.  This works well for a color graph created as shown below. title 'Distribution of Cholesterol

Data Visualization
Sanjay Matange 0
Simply useful

Let us ring in the new year with something simple and useful. A recent question by a user over the holidays motivated this article on what is likely a commonly used graph.  We want to compare the preformance of two categories along with a third measure.  This could be something like "How