In 2011, the passage of the federal Justice Reinvestment Act (JRA) brought significant changes to North Carolina’s criminal sentencing practices, particularly in relation to the supervision of offenders released into the community on probation or post-release supervision. A recent New York Times article highlighted how NC has used the implementation of the JRA to implement cost-saving strategies. Each year the NC Sentencing Commission prepares prison projections that are used by the state Department of Public Safety and the NC General Assembly to help determine correctional resource needs for adult offenders, but the changes resulting from the JRA placed a huge kink into the long-established process used to generate those projections. Use of discrete-event simulation software from SAS helped smooth out the kinks.
The NC Sentencing Commission had been using a simulation model written in C-based code to project NC’s prison population for more than twenty years. The changes imposed by the JRA required new functionality not available in the existing simulation. The Administrative Office of the Courts (AOC) ultimately contracted with SAS to develop a more flexible and transparent prison population projection model using discrete-event simulation.
Traditional time series methods are ineffective for prison population projections because of dynamic factors like sentence length, prior criminal history, revocations of community supervision, and legislative changes. As an alternative, the SAS Advanced Analytics and Optimization Services Group (AAOS) used SAS® Simulation Studio to build a discrete-event simulation model that approximates the journeys of offenders through the criminal justice system. In general, discrete-event simulation is used to model systems where the state of the model is dynamic and changes in the state (called events) occur only at countable, distinct points in time. Examples of events in the prison model include an arrival of an offender in prison or a probation violation.
Process flowcharts provided the framework for the Simulation Studio prison projection model (for those interested in more detail, these flowcharts can be found in a more extended paper on this model presented at SAS Global Forum in 2013). Even though most of the JRA provisions went into effect on December 1, 2011, there will be a period of time for which portions of the JRA do not apply to certain offenders. As a result, the new simulation model incorporates both pre-existing and new legislative policies.
The AAOS Group in R&D translated the logic contained in the flowcharts into a Simulation Studio model. The entities (or objects) that flow through the model represent criminal cases. They have attributes (or properties) such as case number, gender, race, age, and prison term. At simulation execution, case entities are generated and routed according to their attributes over a ten-year period. For example, when it is time for a case entity to be released from prison, a check is done to see if that entity qualifies for post-release supervision. If so, then the entity is routed to logic that samples a random number stream to determine whether or not that entity will commit a violation at some point in the future.
The inputs to the Simulation Studio model are in the form of SAS data sets and include the following:
- Stock data, provided by the Department of Public Safety’s Division of Adult Correction: includes inmates in prison at the beginning of the projection period and their projected release date.
- Court data, provided by the AOC: contains convictions and sentence imposed in the most recent fiscal year.
- Growth estimates: projected growth rate for convictions as determined by the Sentencing Commission’s forecasting advisory group after examining demographic trends, crime trends, and arrest trends.
The court and stock data include both individual-level information (such as demographics, offense, and sentence) as well as aggregate-level information (such as the probability of receiving an active sentence by offense class and the lag-time between placement on probation and a return to prison for a violation).
At the end of the simulation, two SAS data sets are generated, providing a complete history of prison admissions and releases over a ten-year time period. From this data, monthly and annual projections can be prepared at an aggregate level as well by variables of interest such as gender, race, age, and offense class.
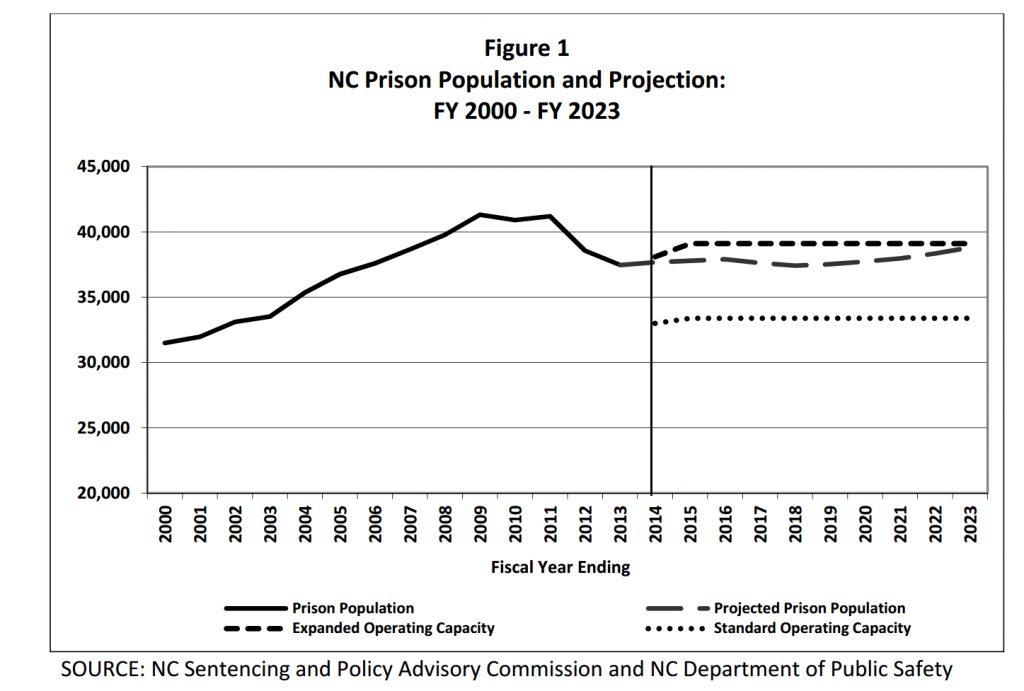
After the AAOS group finished building the simulation model, it was handed over to the Sentencing Commission, along with documentation and training for the Simulation Studio modeling interface, so that the Sentencing Commission could then run the model and make changes as needed. They have used the model to prepare projections for two years now, with the first official results being published in February of 2013. Figure 1 shows the projected prison population and capacity for FY 2014 through FY 2023. The prison population is projected to increase from 37, 679 in June 2014 to 38,812 in June 2023, an increase of 3%. A comparison of the projections with the operating capacity indicates that the projected prison population will be below prison capacity for the ten-year projection period. In June 2014 the actual average prison population was 37,731, so the model-projected population of 37,679 was within 0.2% of the actual. The current projections, as well as projections from previous years, are located on the Sentencing Commission’s website.
This project demonstrates a very promising application of discrete-event simulation in practice. The resulting Simulation Studio model not only incorporates changes to correctional policies as a result of the JRA, but it can easily be modified by the Sentencing Commission to incorporate any future legislative acts that affect the prison process, providing the state the flexibility and transparency they desired. The model can also be extended to project other criminal justice populations (such as juveniles) in both NC and in other states.