Were you the kid who sat there analyzing the amusement park map before entering the park, planning out how you could visit the most rides in the least amount of time? If so, then this blog's for you, my data analyst kindred spirit!
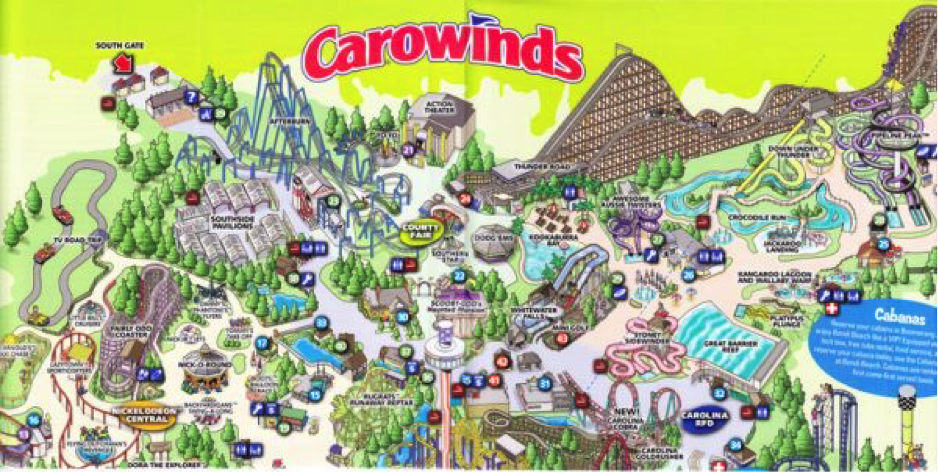
And to get you in the mood, here's one of those amusement park maps. This is a map of Carowinds, the park I went to often when I was a kid:
Some might call it overkill, but if you are serious about your Pokémoning then you will want to use every tool at your disposal - including the most powerful analytics software in the world! In this blog post, I show you how to use SAS software to optimize your search for rare Pokémon.
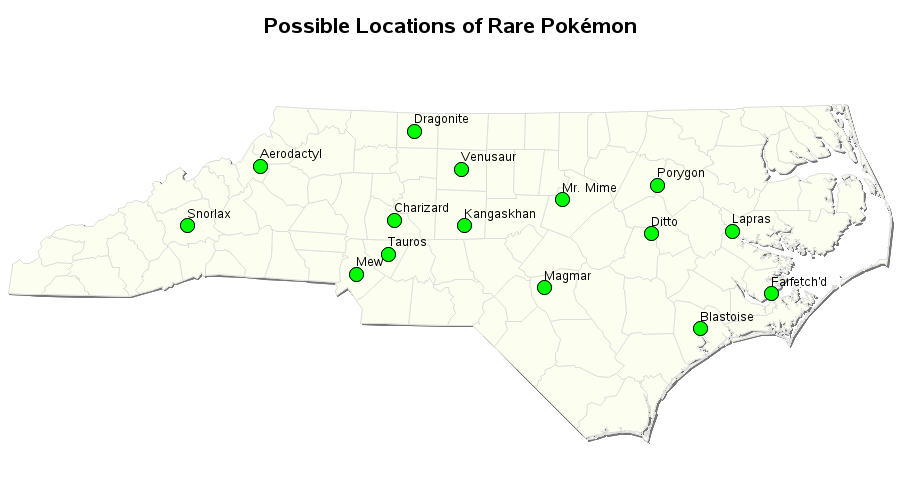
Let's say you've been playing for a while, and only have 15 of the more rare Pokémon left to catch. While you could try hatching them from eggs, you've decided to try a more analytical approach. You have perused all the online forums and compiled a list of possible sightings of these rare Pokémon, and then determined the closest location of each one. You can now plot these on a map using SAS' GMap Procedure:
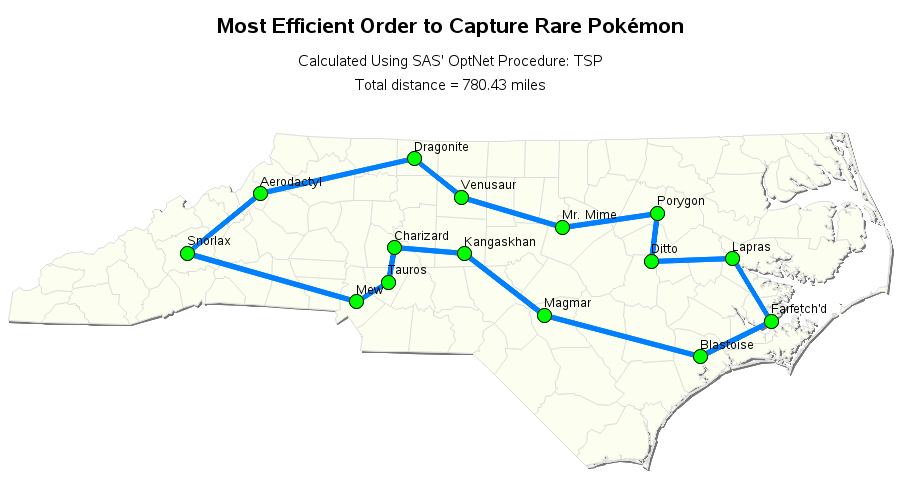
Of course you could start driving across the state, in a random fashion, zig-zagging from one location to the next ... but just like your Carowinds visit, that's not the kind of person you are. You want to find the maximum number of Pokémon in the minimum amount of time and distance. And for that, you can use SAS' OptNet Procedure to calculate the "optimal tour" to visit all the locations in the most efficient order (using the TSP statement to invoke an algorithm that solves the classic traveling salesman problem).
Now that I've demonstrated this technique using some fun data, what non-Pokémon analyses might you be able to use it for? (when you come up with some ideas, here's my code in case you want to re-use it) Don't forget to check out my other Pokémon-related blog posts on: types of Pokémon, contour/heat maps, and the Nintendo stock price!
And for the big question - what's the most rare Pokémon you've caught so far.





8 Comments
This would be great for post-race analysis of the optimal route in an orienteering competition with the special "ROGAINE" format, where the goal is to find as many checkpoint as possible, in any order, within a set time limit, usually 24 hours.
(Besides being the worst sport name ever, ROGAINE is an acronym for Rugged Outdoor Group Activity Involving Navigation and Endurance.)
Sample ROGAINE Course Map
p.s. I only have one Pokémon, and it's Pikachu. ;-)
Hahaha! - I'm so glad you explained what ROGAINE stood for, in this context! :)
Even better than post-race analysis would be to solve the "orienteering problem" (a variant of TSP) ahead of time to determine which checkpoints to visit and in which order to maximize the score within the time budget. We have shown this problem in SAS/OR demos. Please contact me offline at Rob.Pratt@sas.com if you are interested in more details.
Thanks for the extra info, Rob!
TSP is NP complete, correct? How does SAS TSP solve it - is there a number of nodes above which things kind of blow up?
Yes, TSP is NP-Hard. The SAS TSP solver uses a mixed-integer linear programming (MILP) branch-and-cut algorithm. See:
http://support.sas.com/documentation/cdl/en/ornoaug/68159/HTML/default/viewer.htm#ornoaug_optnet_details42.htm
A good book on the algorithmic approach is:
http://www.math.uwaterloo.ca/tsp/book/index.html
Once you get into 1000 or more customers, the exact approach can become slow. In cases like that, you probably want to set the MILP= option to "OFF", so that OPTNET only runs heuristics (and not the MILP solver). The heuristics alone often find very good quality solutions quickly - even for large instances.
Thanks for the help Matthew!
Nice tour!