Author

Don Chapman
RSS
Director, Research and Development

Don Chapman is a Director in the SAS Business Intelligence Research and Development division. His team marries the latest analytic technologies at SAS with a cutting edge user experience to make visual exploration of big data both productive and fun. During his 20 years at SAS, Don has been awarded the CEO Award of Excellence and membership on the R&D High Performance Team. Prior to joining the management team, he was a software engineer focused on user interface development.

Don Chapman 2
How to create geographic visualizations

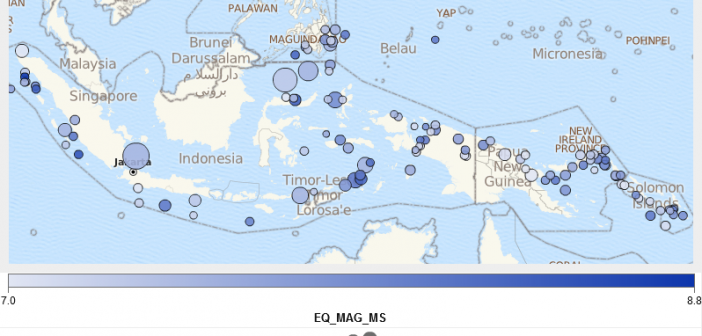
Today I want to focus on geographic visualizations in the SAS Visual Analytics Explorer. Geography-based data can be explored and visualized in a variety of ways. Tables, crosstabs, tree maps, bar charts can all be used, but displaying the information on a geographical map is often the most meaningful way