Tag: BarChart

Data Visualization
Sanjay Matange 2
Overlay Bar Charts

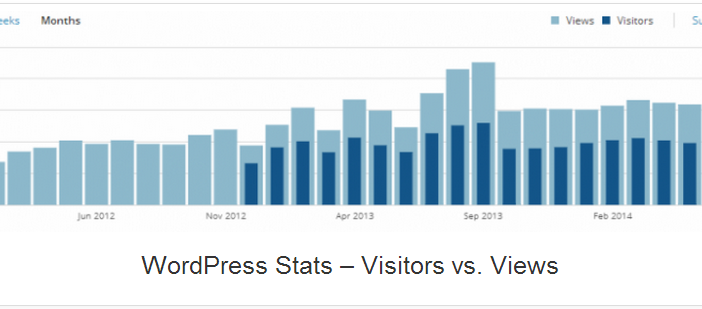
A couple of days back, Rick Wicklin forwarded me a link to an article on the BadHessian Blog on creating a Bar Chart using six different freeware packages in R, Python and Julia.   The target bar chart was one produced by the Jetpack stat module with WordPress.  The graph is shown below. The unique feature of

Data Visualization
Sanjay Matange 3
Butterfly plots

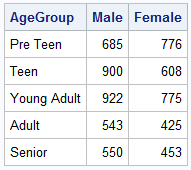
When comparing results by category and group,  putting the items to be compared close together usually leads to a graph that is easier to decode.  Take the case of the data (simulated) shown below. Here we have population by age group and sex.  To compare the population by sex, it is

Data Visualization
Sanjay Matange 4
Custom confidence intervals

Recently a user posted a question on the SAS/GRAPH and ODS Graphics Forum about drawing a plot with custom confidence intervals .  The user has a simple data set with category, response (mean) and custom lower and upper confidence intervals.  The data looks like this: Robert Allison provided the code (proc gplot +