Search Results: datalabel barchart (13)

Data Visualization
Sanjay Matange 2
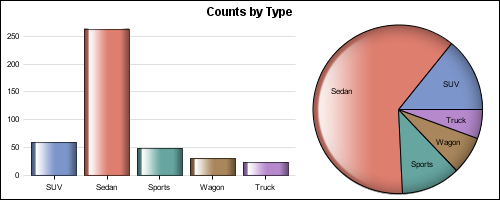
Let them eat pie

ODS Graphics system was initially motivated by the need for high quality graphs for SAS Base, STAT, and other analytical procedures.  Use of SG Procedures, ODS Graphics Designer and GTL by users too has initially focused on analytical graphs.  But just like wheels on carryon bags that started for the specific needs of flight

Data Visualization
Sanjay Matange 7
Nested graphs

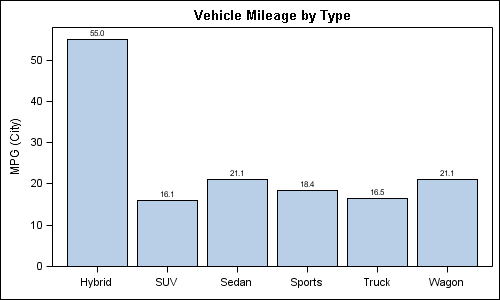
Here are a couple of bar charts showing the city mileage of cars by Type and Origin using the SGPLOT procedure from the sashelp.cars dataset. title 'Vehicle Mileage by Type'; proc sgplot data=cars; format mpg_city 4.1; vbar type / response=mpg_city stat=mean datalabel; xaxis display=(nolabel); run; title 'Counts by Country'; proc sgplot

Data Visualization
Sanjay Matange 4
Custom confidence intervals

Recently a user posted a question on the SAS/GRAPH and ODS Graphics Forum about drawing a plot with custom confidence intervals .  The user has a simple data set with category, response (mean) and custom lower and upper confidence intervals.  The data looks like this: Robert Allison provided the code (proc gplot +