Last week, I presented some highlights of the new features for SG Procedures and GTL in SAS 9.4. Now, let us dig in a bit deeper.
For a plot without a GROUP role, setting an attributes was always easy with SG procedures. All you need to do to set bar color is to set the color suboption in the FILLATTRS option. Or, for a scatter plot, set the SYMBOL suboption in the MARKERATTRS bundle, and so on.
But, when a GROUP role is used, the plot attributes (color, symbol or line pattern) come from the active STYLE on the ODS destination. Setting an attribute as above, will make all groups have the same attribute. Often, this is not desirable. The only way to change the list of attributes was to derive a new ODS style, set the appropriate colors, symbols or line patterns, and then use this new style with your destination.
While all this is easily doable for the experienced ODS programmer, many users of the SG procedures found this a bit cumbersome, and requested an easier way. With SAS 9.4, your wait is over. Now you can set group attributes right within the procedure statement.
Here is an example of a graph with a needle plot of Mileage by Origin with Type as group using SAS 9.3:
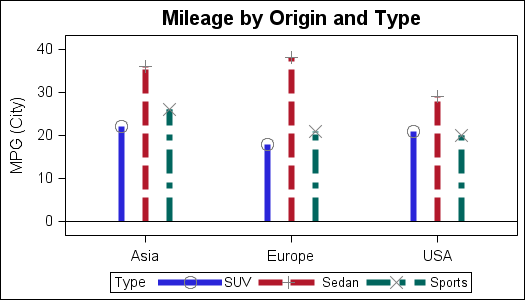
Since we are using the LISTING destination, the default settings for group colors, symbols and patterns come from the LISTING style. To change the group attributes, you will need to derive a new style where the colors, symbols and patterns have to be customized. The MODSTYLE macro can make this a bit easier.
Now, with SAS 9.4, you can set group attributes in the procedure syntax. There is no need to mess with the style. Also, any such settings are local to the procedure step, and will not affect the settings for all other graphs and reports. Here is the graph using SAS 9.4:

SAS 9.4 SGPLOT program:
title 'Mileage by Origin and Type'; proc sgplot data=cars(where=(type in ('Sedan' 'Sports' 'SUV'))); styleattrs datacontrastcolors=(purple green orange) datasymbols=(circlefilled trianglefilled squarefilled ) datalinepatterns=(solid); needle x=origin y=max / group=type groupdisplay=cluster clusterwidth=0.5 lineattrs=(thickness=5) markers markerattrs=(size=11 color=gray) nomissinggroup; xaxis display=(nolabel); run; |
Here we have used the following new features:
- The STYLEATTRS statement with options to set DATACOLORS, DATACONTRASTCOLORS, DATASYMBOLS and DATALINEPATTERNS.
- Here we have set the contrast colors, symbols and line pattern.
- The values provided REPLACE the group attributes derived from style. So, in this case, the plot uses the new contrast colors, symbols and line patterns provided.
- Note: Only one line pattern is provided. So, all lines (needles) get only one (solid) pattern.
- Note: DATACOLORS should be provided for fill colors used with bar charts, band plots, etc.
- As expected, similar options are available on the GTL BEGINGRAPH statement.
Attribute Priority: With SAS 9.3, a new style called HTMLBlue was shipped as the default style for the HTML destination. This style provided a refreshed and improved set of colors and other attributes. One important change was the use of COLOR PRIORITY set by using a new style attribute called ATTRPRIORITY=COLOR.
With this attribute priority, when the system cycles through the group attributes for a series plot, the symbols and patterns are held constant, while each group values get successive colors from the colors list. So, in this case, first group gets first color with first (symbol+pattern). Second group gets second color but still gets the first (symbol+pattern). This continues till the color list is exhausted. Then the next (symbol+pattern) is used. So, if you have < 12 group values, each group value will get the same solid line pattern and symbol, with different colors.
The LISTING style has a ATTRPRIORITY=NONE. This means that colors, symbols and patterns are all rotated simultaneously for each group value. So, first group gets a blue solid line, second group gets red dash line, and so on.
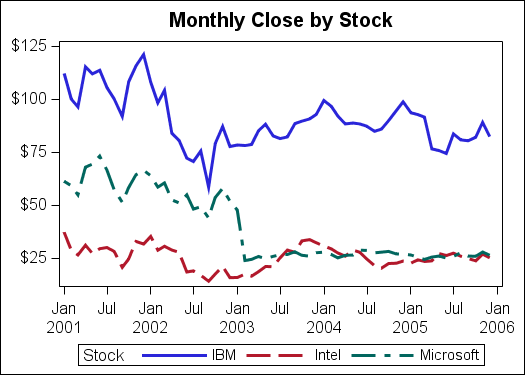
Now, with SAS 9.4, you can set the ATTRPRIORITY in the ODS Graphics statement. This will change the behavior of the style. LISTING style can be made to have priority of COLOR, or the HTMLBLUE style can be made to have priority of NONE. Here is an example of the Stock Plot using LISTING output from SAS 9.3. Note, the series plots for Intel and Microsoft have non-solid lines.
Here is the same graph using SAS 9.4 option of ATTRPRIORITY=COLOR:
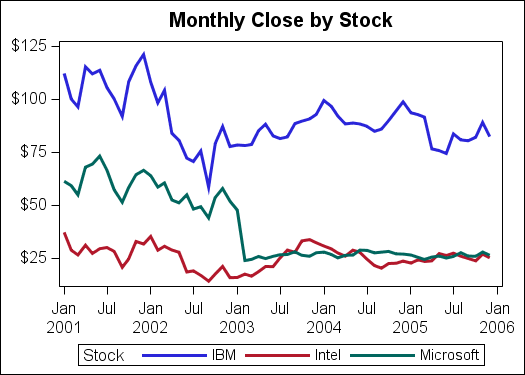
SAS 9.4 SGPLOT Code:
ods graphics / reset attrpriority=color; title 'Monthly Close by Stock'; proc sgplot data=sashelp.stocks(where=(date > '01Jan2001'd)); series x=date y=close / group=stock lineattrs=(thickness=2); xaxis display=(nolabel); yaxis display=(nolabel); run; |
Note the new option used on the ODS GRAPHICS statement - ATTRPRIORITY=COLOR. Now, the LISTING style also uses the same attribute rotation scheme as the HTMLBlue style.
Summary: Two new convenience options have been added to make life a lot easier for users of SG procedures and GTL. No longer do you need to mess with ODS Styles just to get the right group colors. Of course, if you want this kind of change to apply to all your graphs, it is still better to derive a custom style using the TEMPLATE procedure or MODSTYLE.
Full SAS 9.4 Program: SAS94_StyleAttrs


4 Comments
This is very helpful. Thank you!
Hi Sanjay,
Thank you so much for providing us with so many hints and tips through your blog. I really appreciate and admire.
While implementing this styleattrs feature in PDF destination or even html, I'm not able to get different marker symbols. Its taking the first from the datasymbols list. However, when the destination is listing or RTF, this works. Is it a known fact? or in future version we can expect this feature to work well for PDFs? or I'm missing anything in my code?
Regards,
Abhijit Roy
GlaxoSmithKline
If you are seeing the first marker used repeatedly with changing colors for all groups, that means you are using a style that has ATTRPRIORITY=COLOR. The HTMLBlue style uses this setting. This means that marker symbols are held constant while colors are changed for the different group values till all 12 colors are used. Then, for 13th group value, the 2nd symbol will be used. To change symbols and colors together for all group values, use a style with ATTRPRIORITY=NONE, such as LISTING. Or, you can set ATTRPRIORITY=NONE on the ODS GRAPHICS statement with any style.
Pingback: Getting started with SGPLOT - Part 2 - VBAR - Graphically Speaking