
In his Spring 2014 article in Foresight, Paul Goodwin addressed the important issue of point vs. probabilistic forecasts.
A point forecast is a single number (e.g., the forecast for item XYZ in December is 635 units). We are all familiar with point forecasts, as these are what's commonly produced (either by the software, or judgment) in our forecasting processes.
The problem is that point forecasts provide no indication of the uncertainty in the number, and uncertainty is an important consideration in business planning. Knowing that the forecasting is 635 +/- 50 units may lead to dramatically different decisions than if the forecast were 635 +/- 500 units.
There are a number of ways to provide a probabilistic view of the forecast. With prediction intervals, the forecast is presented as a range of values with an associated probability. For example, "the 90% prediction interval for item XYZ in December is 635 +/- 500 units." This would indicate much less certainty in the forecast than if the 90% prediction interval were 635 +/- 50 units.
A fan chart provides a visual expansion of a prediction interval over multiple time periods. In Goodwin's example, the darkest band represents the 50% prediction interval, while the wider ranges show the 75% and 95% intervals.

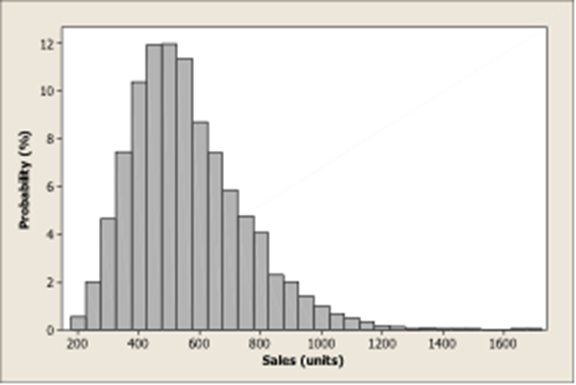
A probability density chart can provide even more granular detail on the forecast for a single time period. In this example, the most probably sales are around 500 units, but will almost certainly be between 200 and 1200.
Goodwin reviews recent literature on the value of communicating uncertainty, and suggests that it can lead to improved decisions. However, research also showed that if interval forecasts are too wide, they were judged to be uninformative and less credible. So even if 635 +/- 500 is the appropriate width of the 90% prediction interval, decision makers may simply ignore the forecast and doubt the competence of the forecaster who produced it!
Estimating the level of uncertainty may be non-trivial, particularly when forecasts are based on human judgment. Research has repeatedly shown that people produce intervals that are far too narrow. Goodwin cites a 2013 study of financial executives providing 80% prediction intervals for one-year-ahead stock prices. Actual returns fell within the 80% intervals only 36% of the time!
A simple way to address inappropriately narrow intervals was suggested by Makridakis, Hogarth, & Gaba in one of my favorite forecasting-related books, Dance With Chance. They suggest taking your estimated prediction interval and doubling it. (I love a quick and dirty solution to a complex problem.)
Learn more in the next Foresight / SAS Webinar
On December 3, 10:00am ET, Paul Goodwin will present his finding in the next installment of the Foresight / SAS Webinar Series.
This webinar will discuss recent research suggesting that people make better decisions when forecasts contain information on uncertainty. It will demonstrate how to:
- Estimate uncertainty.
- Use forecasting uncertainty to your advantage.
- Present forecasts in ways that are credible, understandable and useful.
Register for "Getting Real About Uncertainty in Forecasting" and watch the 30-second video preview.
Update 2/23/2016: Goodwin's Article Available in New Book
Paul Goodwin's article is included in the new book, Business Forecasting: Practical Problems and Solutions (Wiley, 2015).

5 Comments
Pingback: Foresight/SAS webinar December 3: Getting real about uncertainty - The Business Forecasting Deal
Pingback: Foresight/SAS webinar December 3: Getting real about uncertainty - supplychain.com
Understanding and accounting for uncertainly is really important with forecasting. It's very hard to be on the nose with projections and forecasts, so what acceptable RANGE are you okay with? A forecast is a very educated and data-supported guess, but it is still a guess.
Agreed, the forecast should be an "unbiased best guess at what is really going to happen." The person generating the forecast should provide a range that, to the best of their ability, truly represents the uncertainty. A range (or better yet, a probability distribution of forecast values) should be seen as a blessing by management -- this additional information (beyond just the point forecast) can help them make better decisions. But of course, as Paul Goodwin points out, management may not find the range acceptable (they want CERTAINTY about the future).
Pingback: Paul Goodwin on misbehaving forecasting agents - The Business Forecasting Deal