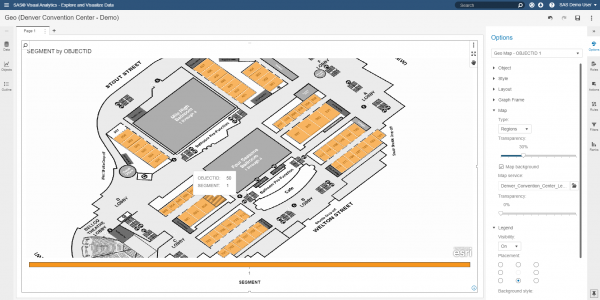
Can you use a data visualization tool to display building maps, floor designs and other Esri data? With the recent addition of custom polygon support in SAS Visual Analytics 8.2, customers wondered if this feature can be utilized to render different types of regional overlays. A common request is to
Tag: map
A few weeks back I saw a couple of posts on the Communities page from users wanting to find ways to compute the area of an general polygon and also the center of the area. I felt such features likely existed somewhere in the SAS/GRAPH set of procedures, so I asked our resident
February is one of my favorite months. Each year, I get to spend the last week of February in California, hanging out with my buds. It’s because the blind guy goes to this conference in San Diego dedicated to making life better for people with disabilities. A lot of blind
Growing up in Michigan, I, like all state residents, learned early on that the lower peninsula of Michigan is shaped like a mitten. This piece of information has served me well all my life; whenever I meet a stranger who wants to know where in Michigan I grew up, I
I've written about this topic before, but find that more people are interested in how this works. Hoping to provide more detail below. Let me know if I missed anything! When using the 'GEO' dimension type in SAS OLAP Cubes, users will not see anything new unless the OLAP cube
The SAS Business Intelligence suite includes the ability to map data via the ESRI Map Service within various web clients (and even Enterprise Guide). Steps: Create an ESRI Map via ArcMap Publish to ArcGIS Server via ArcCatalog Define a New Map Service in SAS Management Console Set a cube dimension as
While working on a SAS OLAP and ESRI project, I was asked about geocoding addresses. Fortunately, Jeff Phillips, one of the SAS presenters at SESUG09 gave a talk about PROC GEOCODE. In SAS 9.2, street addresses can be given x/y coordinates via the geocode procedure using the 5 or 9