Strengthen your programming skills with tips and techniques from the experts
Performance tips for viewing data in SAS Enterprise Guide

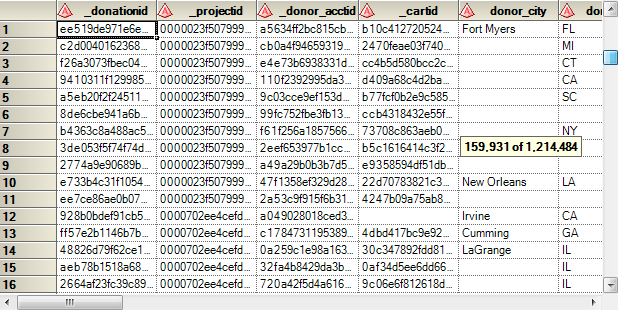
SAS users love to look at data. And the data grid in SAS Enterprise Guide is a convenient way to view the contents of a data set. While small data sets can be rendered lickity-split for quick viewing, sometimes people get justifiably anxious when opening very large data. Perhaps they've