Get the right information, with visual impact, to the people who need it
A beginner's tutorial on ... bar charts

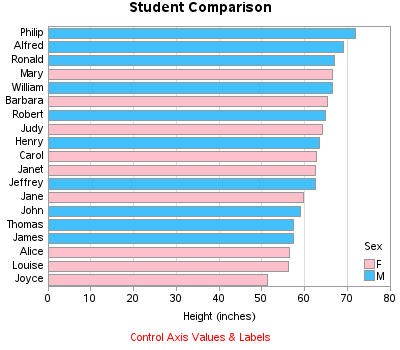
Do you know how to create a bar chart using SAS, and when to use what kind of bar chart?!? If the answer doesn't come to you "easy as pie" then this blog is for you! Below are several examples of different kinds of bar charts you can create with SAS/GRAPH.