Get the right information, with visual impact, to the people who need it
SAS Wonder Twin powers ... activate!

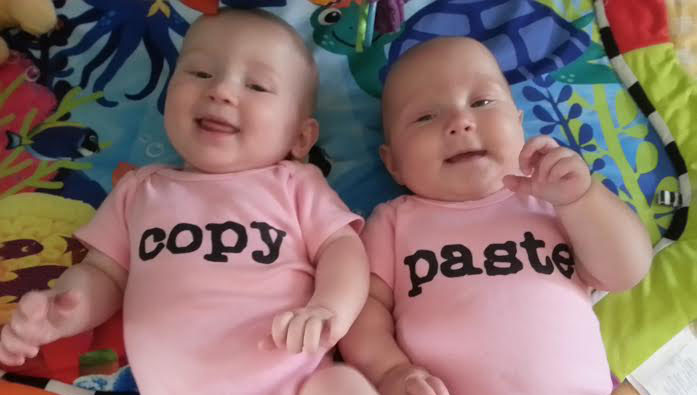
All my friends seem to be having twins these days (below is a picture of my friend Holly's twins, for example) - I wondered if I could use SAS to analyze this twinning trend ... When I was growing up, way back in the day, twins seemed to be rarity.