Get the right information, with visual impact, to the people who need it
Axis Break Appearance Macro

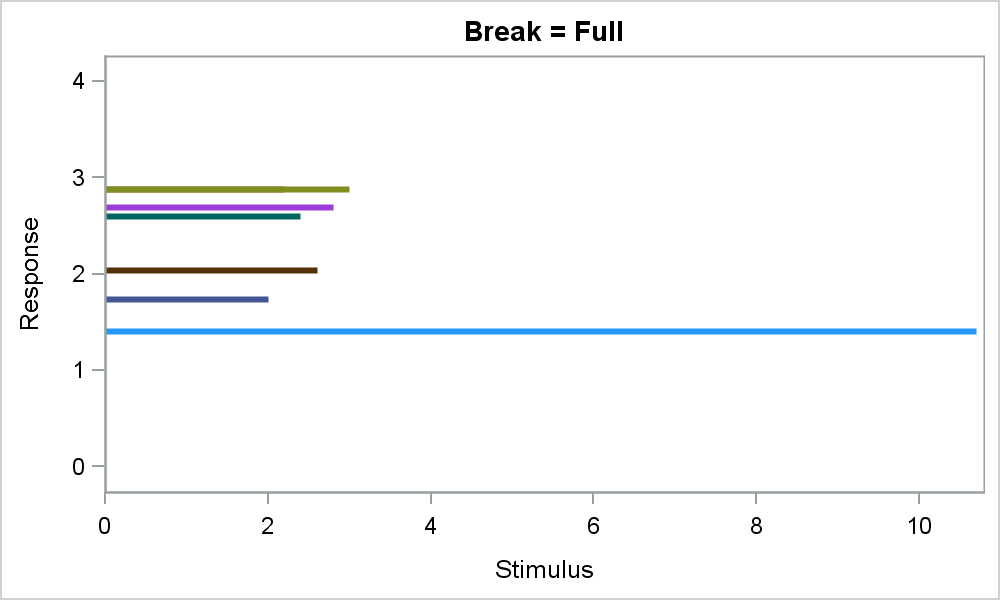
Often, we have data where most of the observations are clustered within a narrow range, with a few outliers positioned far away. When all the data is plotted, the axis is scaled to accommodate all the data, thus skewing the scale. Techniques to handle such data have been addressed earlier