Get the right information, with visual impact, to the people who need it
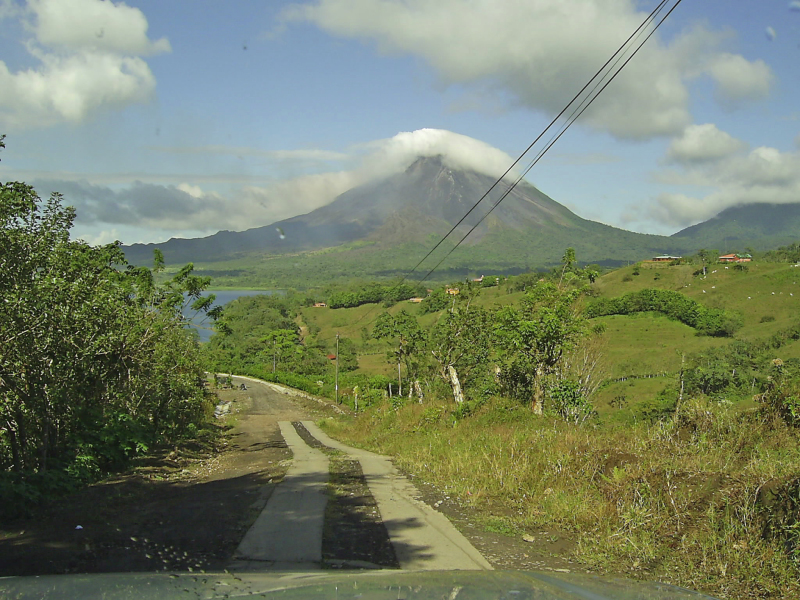
Locating Mount St. Helens using a SAS map

Mount St. Helens volcano here in the US had a big eruption 35 years ago this week! Do you know exactly where it is located? Perhaps this SAS map can help... As you might have guessed, I'm a big fan of the awesome power of nature (hurricanes, tornadoes, lightning, earthquakes, and