Get the right information, with visual impact, to the people who need it
Tracking West Nile virus mosquitos in the US

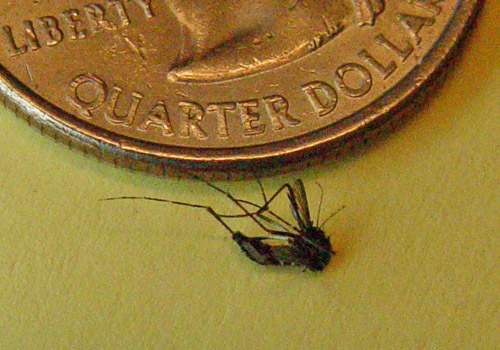
Have you ever been bitten by a mosquito? What are the odds it carried the West Nile virus? ... Perhaps a lot higher than you thought! Here's a picture of a mosquito that kept 'bugging' me around my computer desk at home - good riddance, I say!