Get the right information, with visual impact, to the people who need it
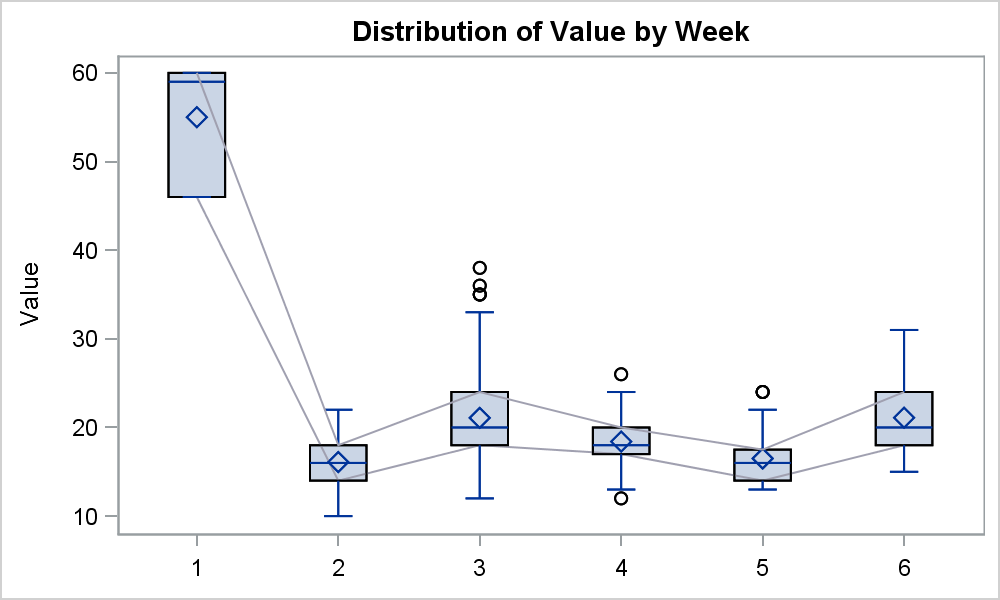
Easy Box Plot with Multiple Connect Lines

Last month I wrote an article on connecting multiple statistics by category in a box plot using SGPLOT. In the first article I described the way you can do this using overlaid SERIES on a VBOX using SAS 9.4, which allows such a combination. However, if you have SAS 9.3,