Data Visualization

Get the right information, with visual impact, to the people who need it
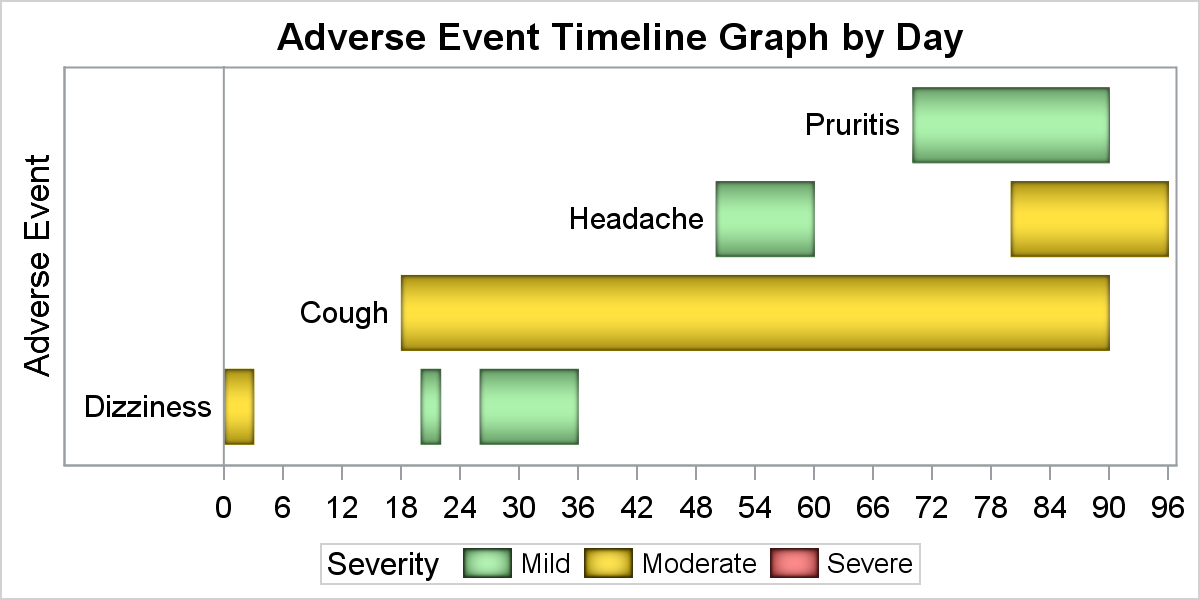
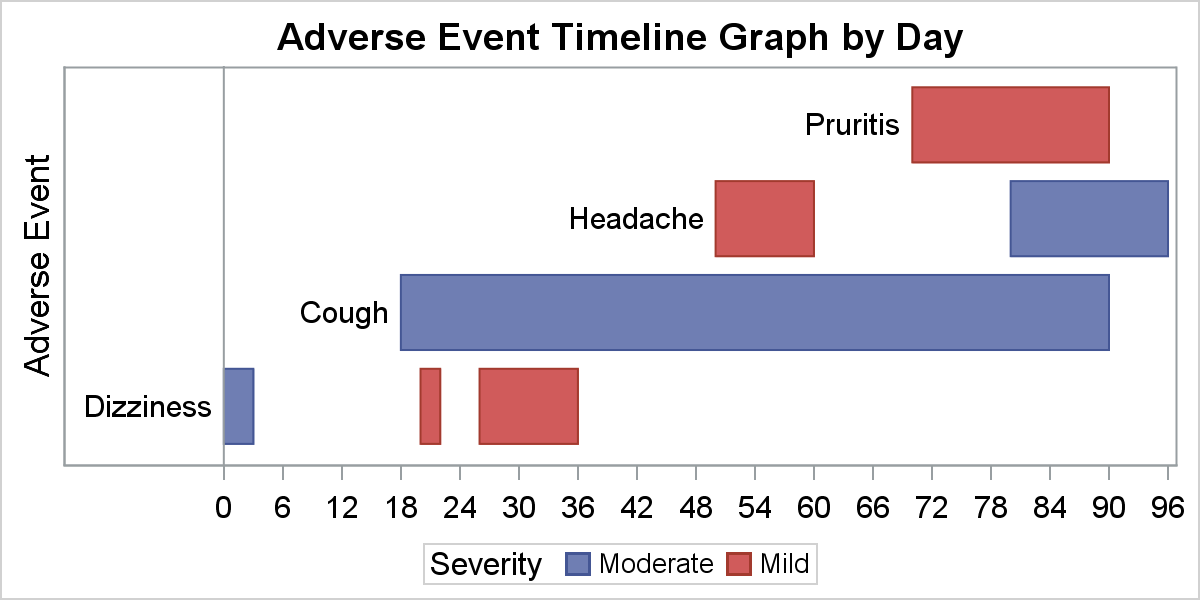
Data Visualization
Sanjay Matange 0
Legend Order

In the previous article on managing legends, I described the way to include items in a legend that may not exist in the data.  This is done by defining a Discrete Attribute Map, and then requesting that all the values defined in the map should be displayed in the legend. In

Data Visualization
Sanjay Matange 0
Legendary

Entries in a legend are populated automatically based on the data.  When creating a graph with group classification,  the display attributes for each bar are derived from the GraphData1-12 style elements from the active style. The graph on the right shows you the result of creating an adverse event timeline

1 363 364 365 366 367 538