Get the right information, with visual impact, to the people who need it
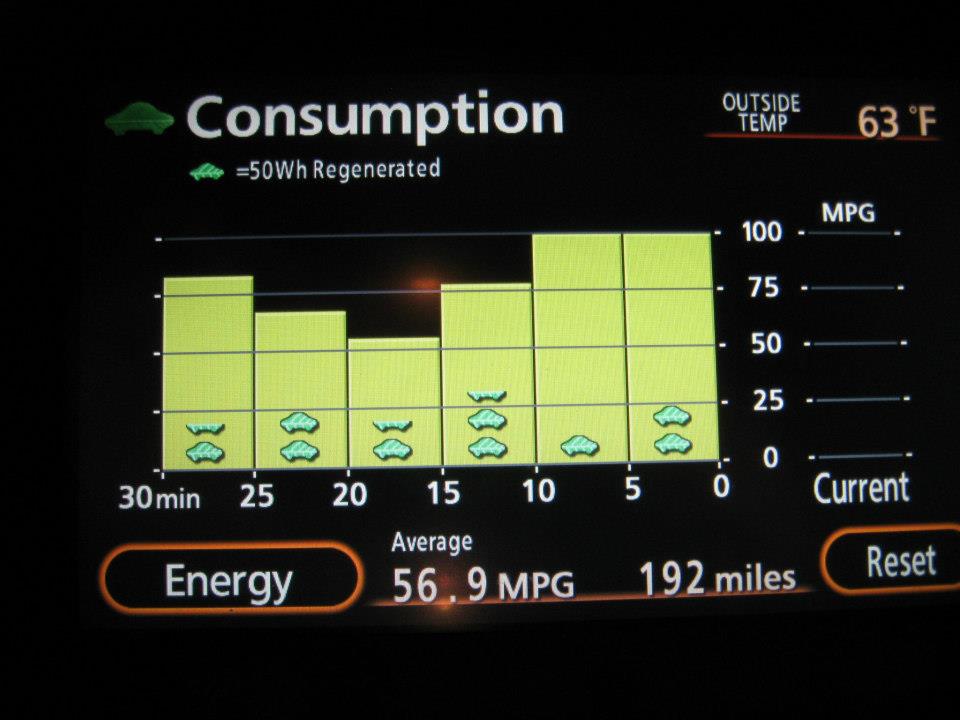
Which hybrid model gets the best gas mileage?

When the Toyota Prius first came out, the gas mileage claims astonished everyone. But now that almost every manufacturer offers their own hybrid, is the Prius mpg really all that great? Let's analyze the data ... But before we get to the analytics, let me tell you a little about