Get the right information, with visual impact, to the people who need it
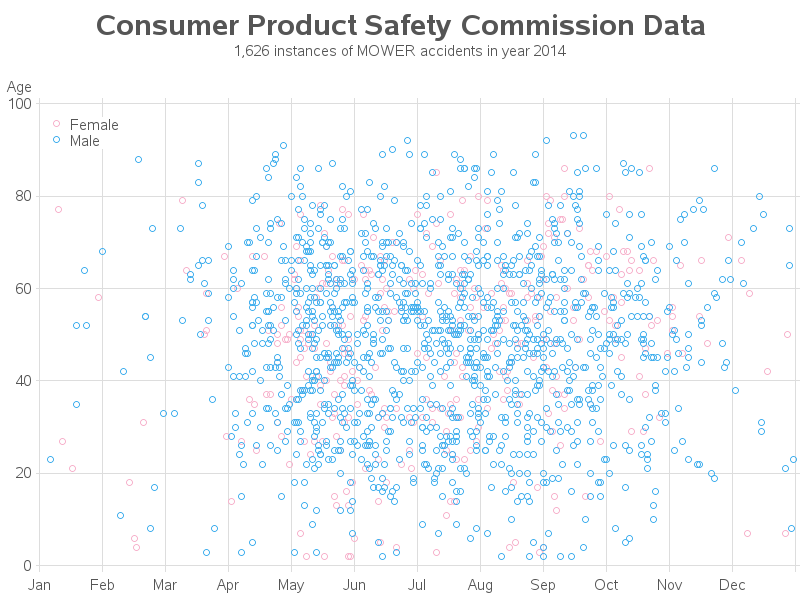
Beware the Ides of March and lawn mowers!

If you're a worrier, you know there's a chance you could get bitten by a shark, or hit by a piece of falling satellite debris - these events are both possible, but not probable. Getting injured by a lawn mower, on the other hand, is something that could easily happen. With