Get the right information, with visual impact, to the people who need it
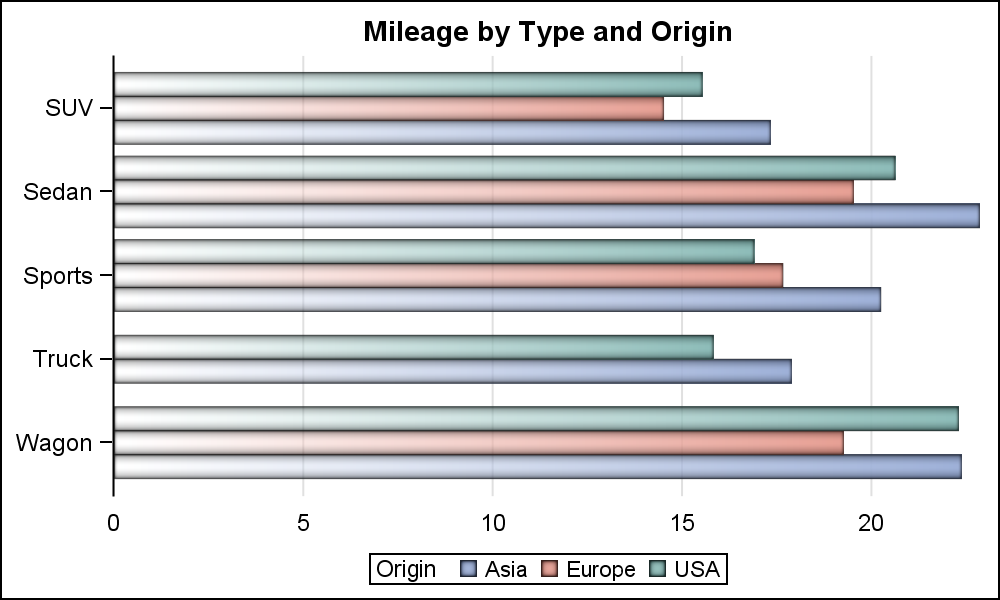
Displaying Group Values on the Axis

Recently a user was working with the HBAR statement with cluster groups with SG procedures. User wanted to see the group values on the axis. SGPLOT does not display multi level axes as these are shared with different plot types. However, with SGPLOT, there is often a way to get