Get the right information, with visual impact, to the people who need it
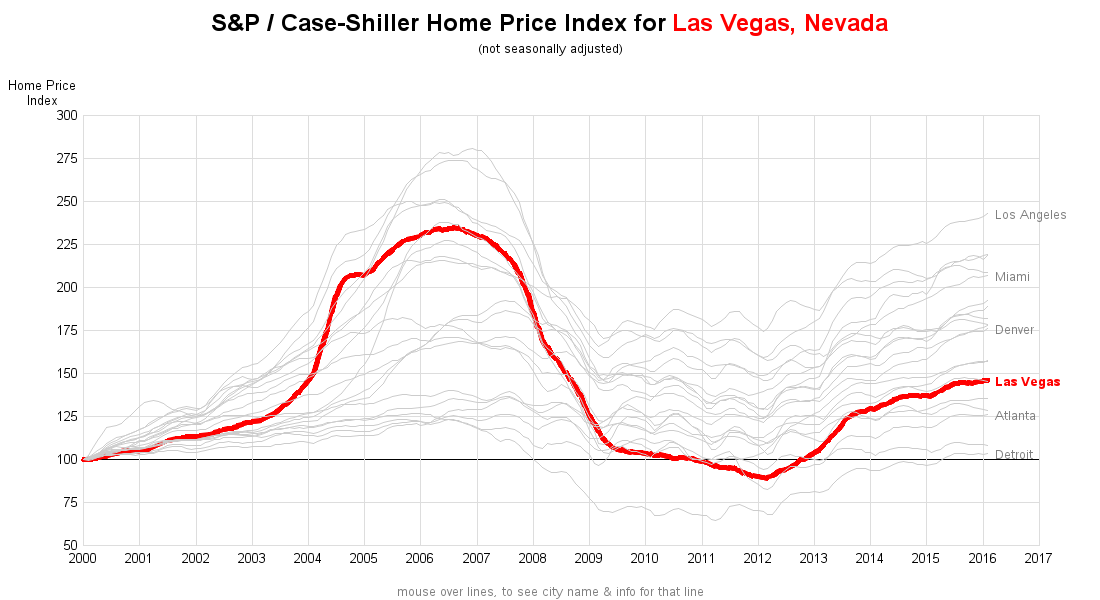
You don't know squat about the Las Vegas housing market

How bad was the recent recession on the Las Vegas housing market, and what lingering side effects are still being felt? If you don't know squat about real estate housing markets, then this blog post is for you! It takes a simple graphical look at some data that helps explain