Get the right information, with visual impact, to the people who need it
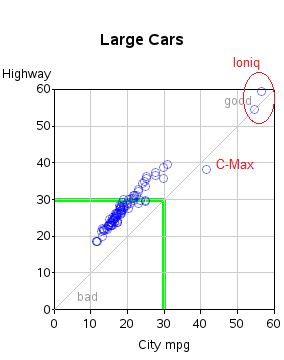
Prius isn't the highest-mpg hybrid in 2017!

For many years, the Toyota Prius was the hybrid with the best mpg - but in 2017 that's changing! Let's examine the data ... For analyses like this, I have found the fueleconomy.gov website to be a wonderful source of information. In recent years, they've even made all their data