Get the right information, with visual impact, to the people who need it
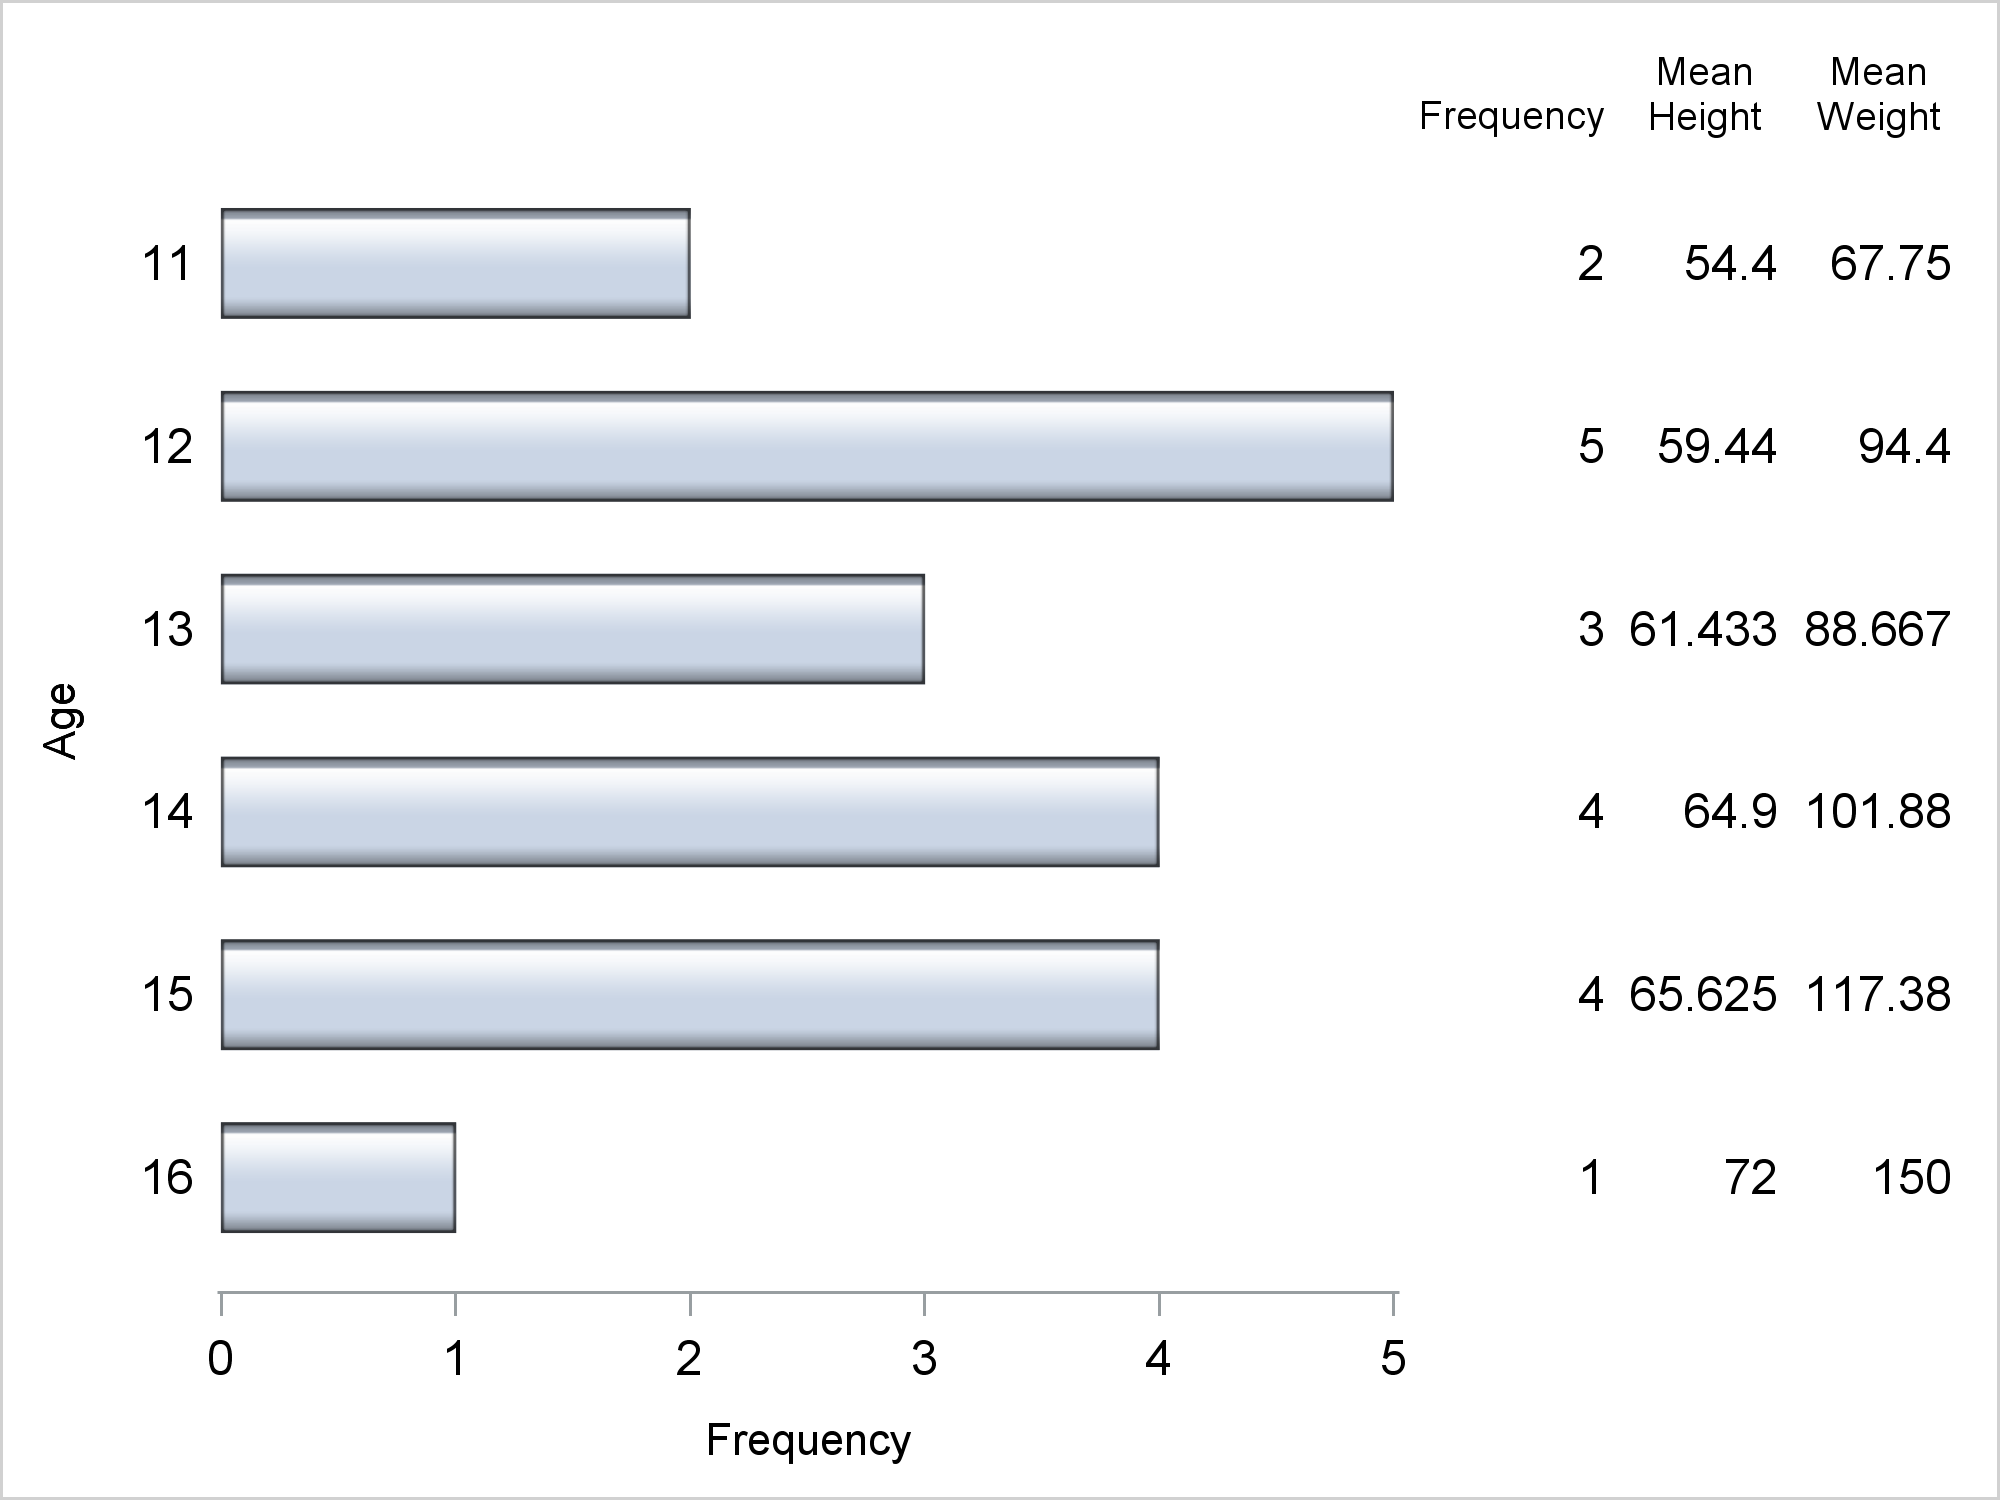
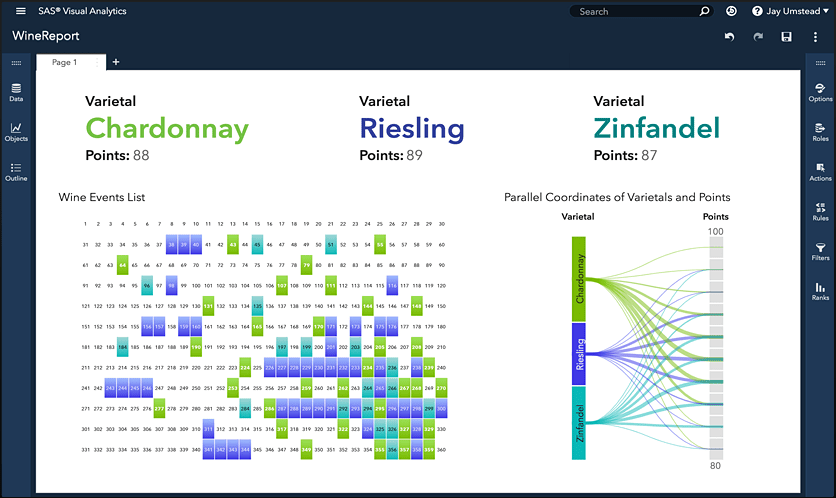
Advanced ODS Graphics: Two types of axis tables

Axis tables can use the SUM= option to summarize data and display means, medians, sums, and percentages. They can instead be used to display data, text, and statistics without any summarization.