Get the right information, with visual impact, to the people who need it
This Doesn't Make "Cents" -- A Question about Formatting

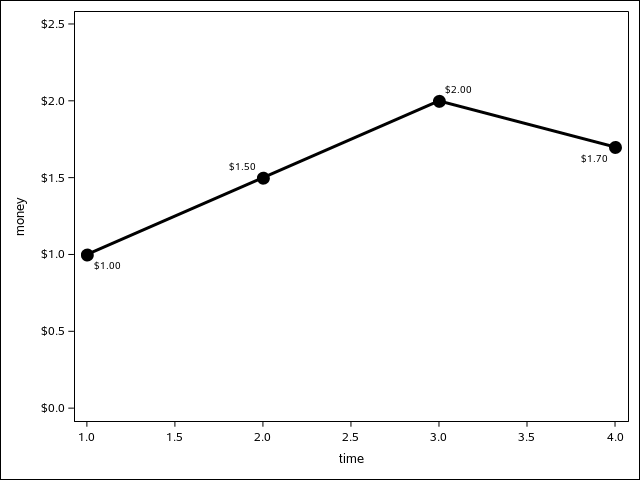
Recently, I was asked about a formatting situation where the DOLLAR8.2 format was specified on the data column, but the cents on the axis showed showed just one digit instead of the two requested by the format. data example; input time money; datalines; 1 1 2 1.5 3 2 4