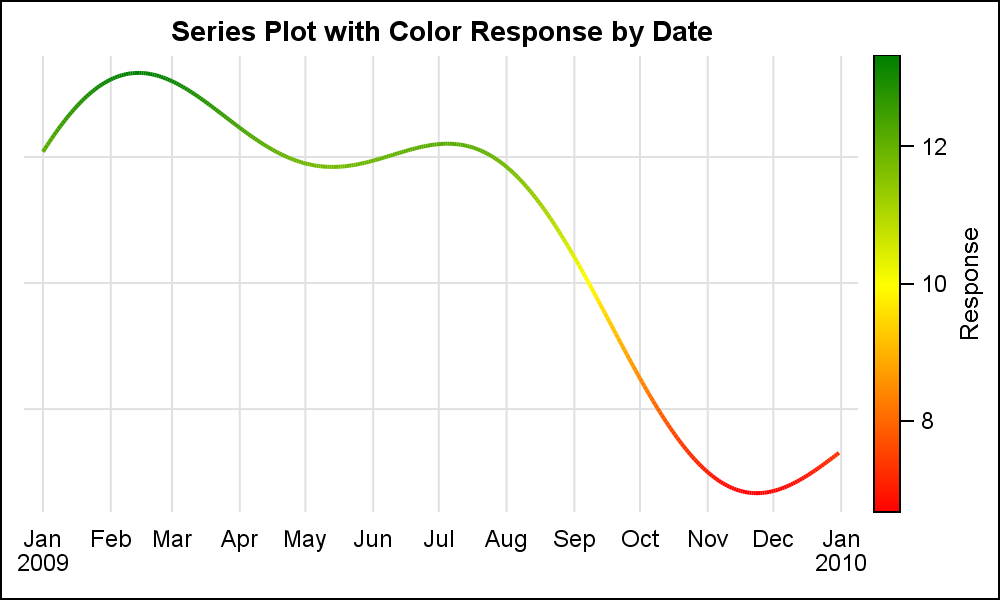
Returning from my recent visit to India, I was reading an article that included a graph with a series plot where the color of the series itself changed based on the Y response. Now, for sure, the SAS 9.40M3 SERIES plot in the SGPLOT procedure supports color response, but that applies
Tag: Vector
Series Plot with Response Color Segments
Response Colors and Thickness
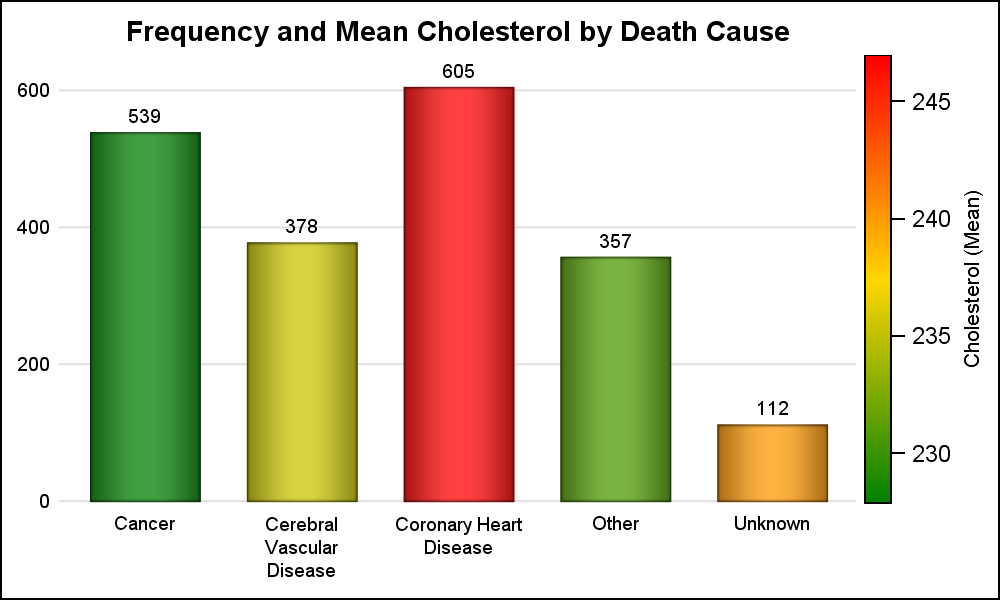
Often there is a need to display more than one response simultaneously for a bar chart, series plot or a vector plot. SAS 9.40M3 adds the options you need to get such results using two new options COLORRESPONSE and THICKRESPONSE where applicable. The Bar Chart on the right shows the frequency
Spirals
Spirals are cool. And useful. We use them every day without thinking about it. Every time the road turns from a straight line to a curve, we go through a transition spiral. Spirals allow us to change curvature in a steady increasing or decreasing fashion. Without a spiral, this