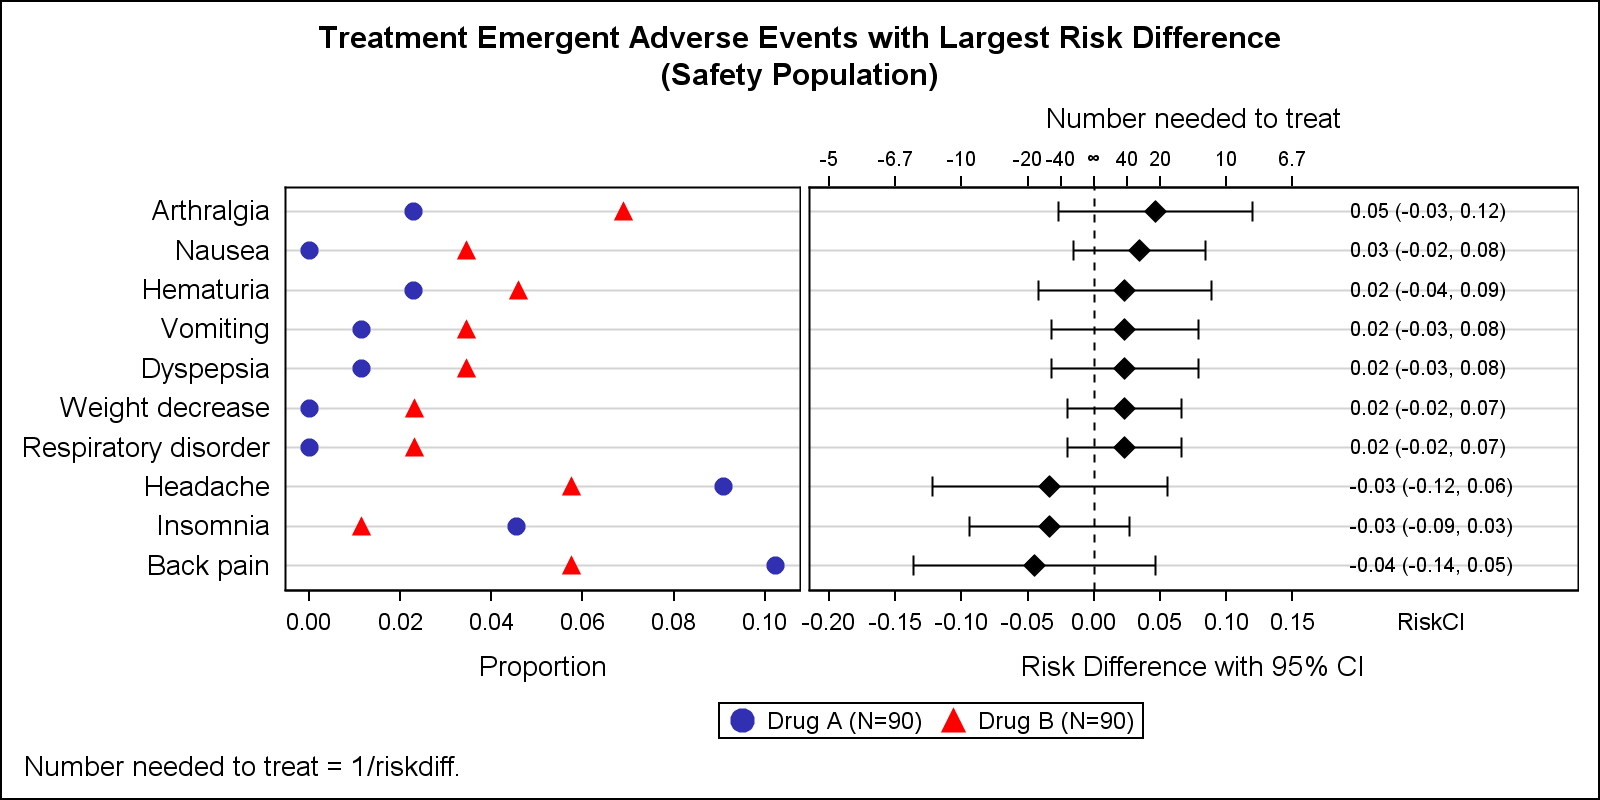
Adverse Events Graph with NNT

Early last year I wrote an article on how to create the "Most Frequent Adverse Events Sorted by Relative Risk" graph using the SGPLOT procedure. The key issue here is that such a graph normally displays two plots side by side, a scatter plot of the proportion values by treatment