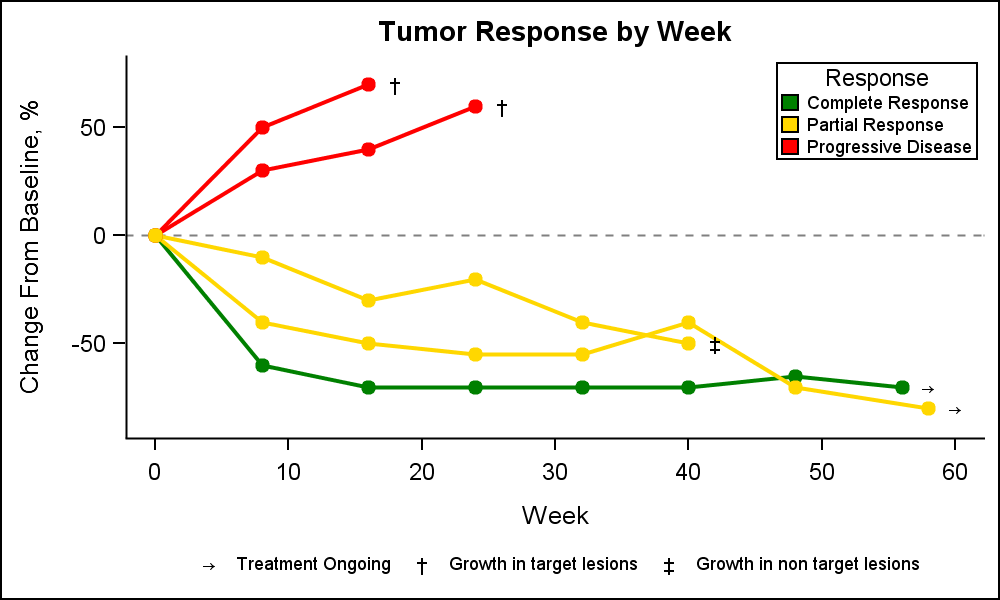
Clinical Graphs: Spider plot
A Spider Plot is another way of presenting the Change from Baseline for tumors for each subject in a study by week. The plot can be classified by response and stage. Another way of displaying Tumor Response data was discussed earlier in the article on Swimmer Plot. This article is prompted
