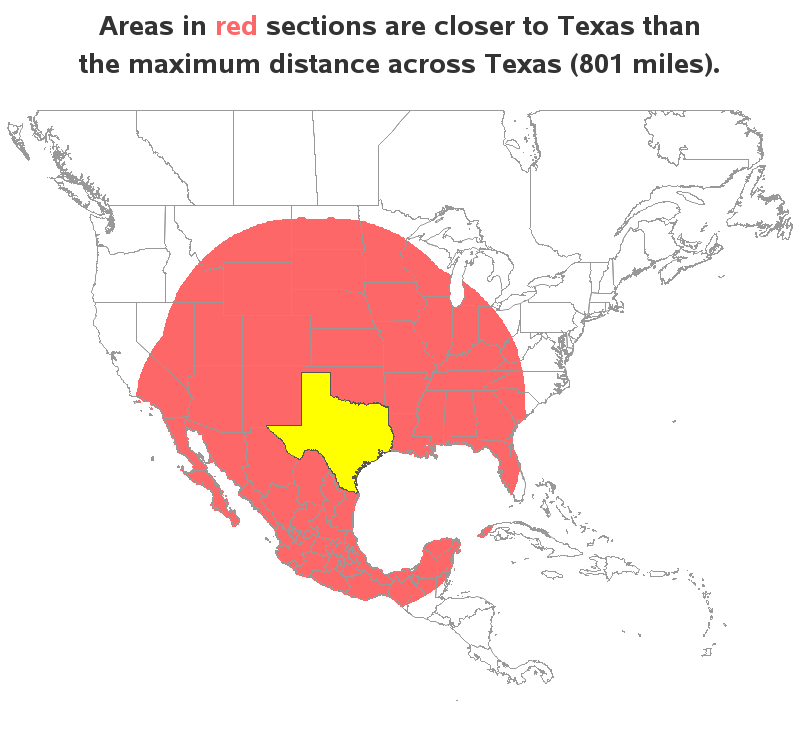
Everything's big in Texas - at least that's what they say! Therefore let's have a bit of graphical fun, and use Texas as a unit of measure (let's call it a 'tex'). More on that later - but first, here's a picture of my friend Jennifer posing beside a rather
Tag: spatial analytics
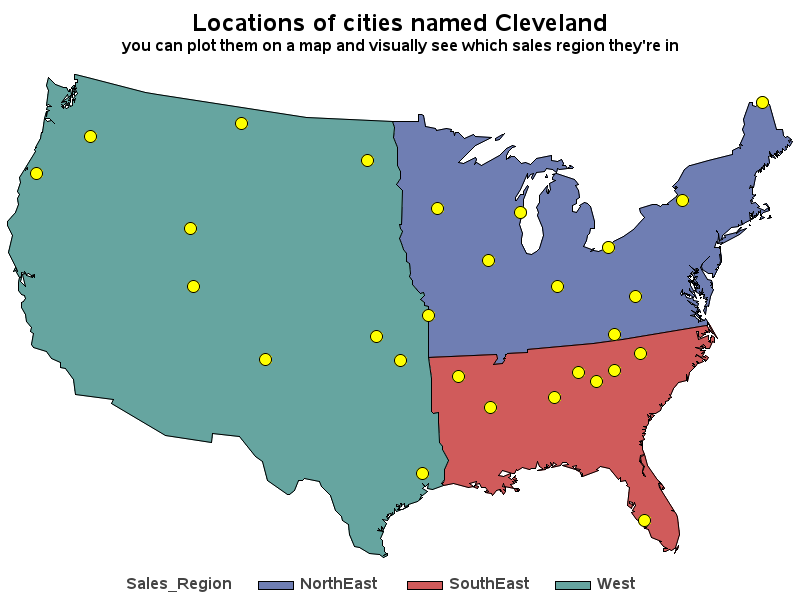
A new prospective customer enters their personal information on your web page, and they want to have a sales rep contact them ... but you need to know which sales region they're in, so you can assign them to a sales team. Now, multiply that by thousands of prospective customers!
Have you ever wondered how far you live from the closest nuclear power plant? I've crunched the numbers for cities here in the US, and created an interactive SAS map to help answer that question! The average age of US nuclear power plants is 35 years, and there just doesn't
SAS has been used to track the spread of many things, such as wild animals, tornadoes, and money launderers -- but this time I'm using it to track the spread of Walmart stores across the U.S. over time! Since its start in the 1960s, Walmart has grown to be the largest
Many people today just use their computer to play Angry Birds or post pictures of their most recent meal on Facebook ... but what would some of the great minds of the past have done with a computer?... For example, Charles Minard was creating impressive information graphics without a computer over 100 years ago,