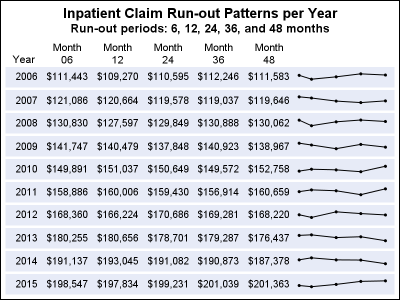
Spark table
In the previous post, I discussed creating a 2D grid of spark lines by Year and Claim Type. This graph was presented in the SESUG conference held last week on SAS campus in the paper ""Methods for creating Sparklines using SAS" by Rick Andrews. This grid of sparklines was actually the
