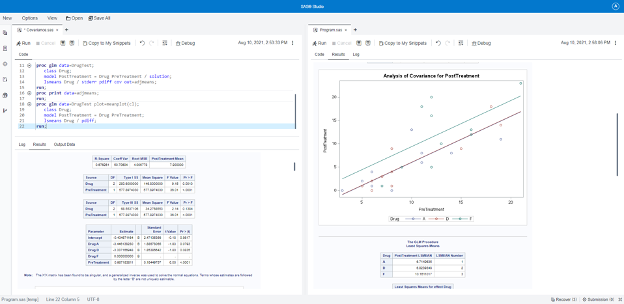
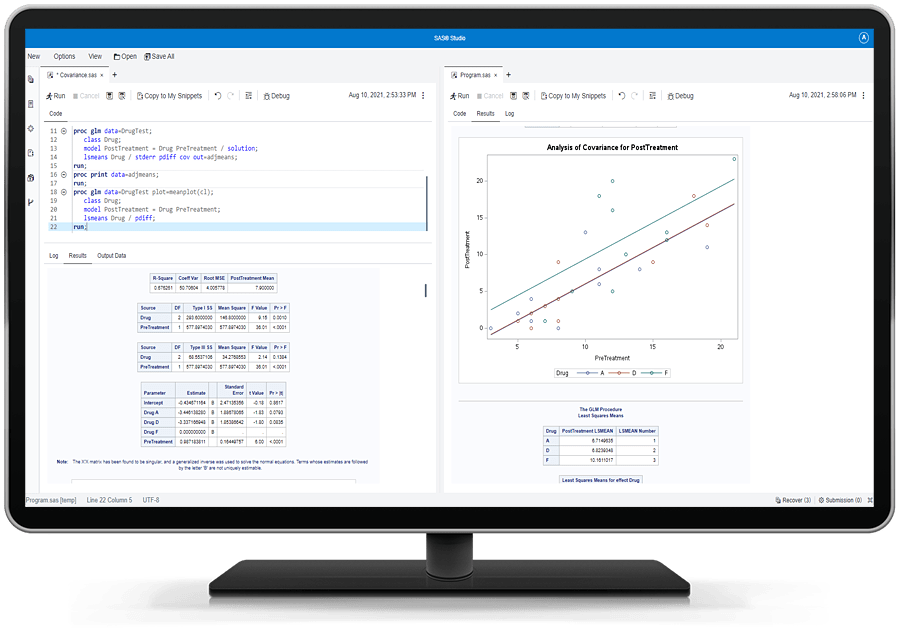
SAS Analytics Pro Advanced Programming offers key statistical capabilities in a docker container. The product bundles selected executables from SAS Viya to create the container, which eases or streamlines the setup required for fixes and updates to the software.
Tag: sas graph
SAS Analytics Pro consists of three core elements of the SAS system: Base SAS®, SAS/GRAPH® and SAS/STAT®. The containerized deployment option adds the full selection of SAS/ACCESS engines making it even easier to work with data from virtually any source.
SAS Analytics Pro is an easy-to-use, yet powerful package for accessing, manipulating, analyzing and presenting information. It lets organizations improve productivity with all the tools and methods needed for desktop data analysis – in one package.
When you create maps, you are typically plotting data for analytics -- but you can also use SAS to create 'pretty' maps for background decorations (for posters, slides, presentations, etc). This blog shows you a few examples... A few years ago I noticed that the CNN Situation Room had a decorative
SAS/GRAPH gives you the ability to customize your graphs (or even create totally new types of custom graphs) ... and it is my firm belief that it gives you a competitive advantage by allowing you to "make sense" of your data in ways your competitors can't. Most of the examples in
Growing up in Michigan, I, like all state residents, learned early on that the lower peninsula of Michigan is shaped like a mitten. This piece of information has served me well all my life; whenever I meet a stranger who wants to know where in Michigan I grew up, I