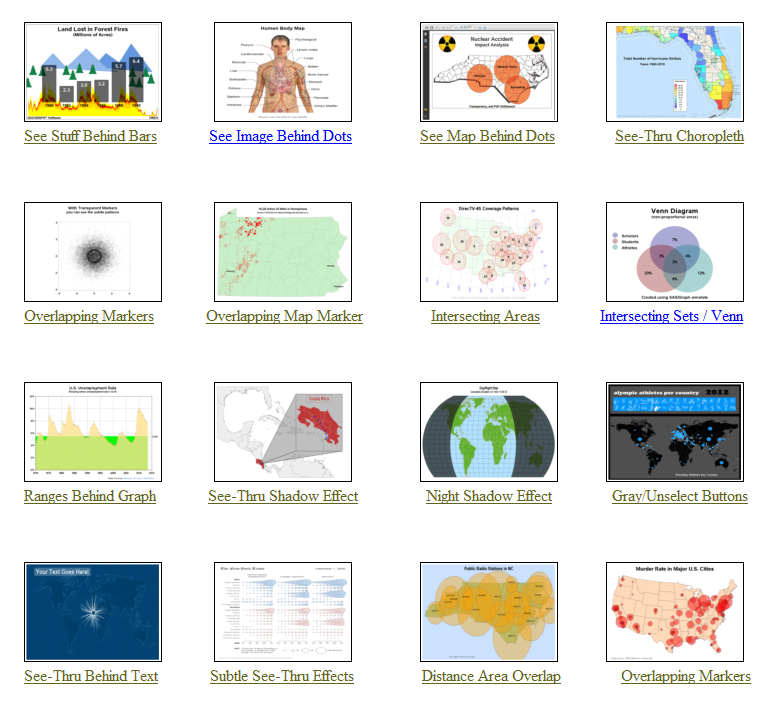
This graph certainly makes it clear! I can see right through your lies! Clearly, you know what you're talking about! We need more transparency in our organization! What was that all about, you might ask?!? ... I was just getting all the obvious puns out of the way, so I
Tag: robs_examples
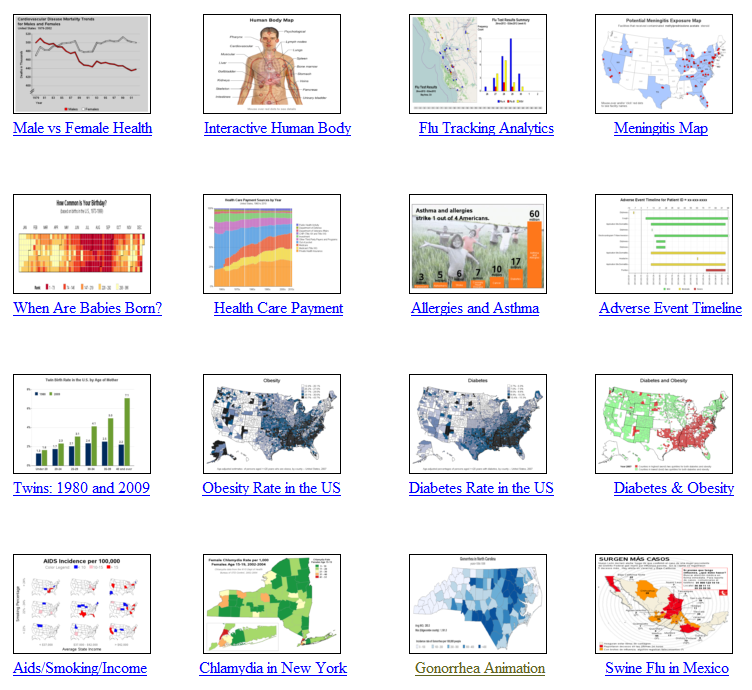
"It slices, it dices ... it helps test laboratory mices!" In a joking way, this is a perfect description of SAS software, don't you think!?! :) And to prove it, this blog contains a collection of 32 examples, showing a variety of ways SAS can be used to graph data
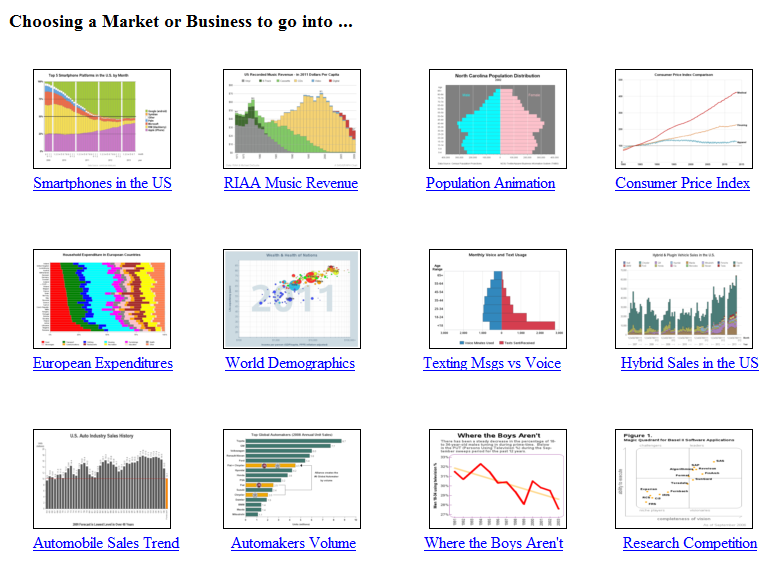
"It's a floor wax, and a dessert topping" - this pretty much describes SAS/Graph! (bonus points if you know where this quote came from!) Some people think of SAS as just a quality control tool. Others think of it as just a sales & marketing tool. And yet others think
I haven't seen an official definition of 'infographic' that I really like ... but in my mind it's something 1/2 way between data visualization & artwork. It borrows elements from graphs & dashboards, and combines that with an artistic poster. If you perform a Google image search on infographic you'll see
While I'm waiting for the next "data intense" event to show up in the news (so I can blog some SAS graphs about it), I thought I'd share a few fun SAS graphs in the spirit of the holiday season! Please don't hold me to too high of graphical "best practices"