How to show recessions (or other ranges) on a time series plot

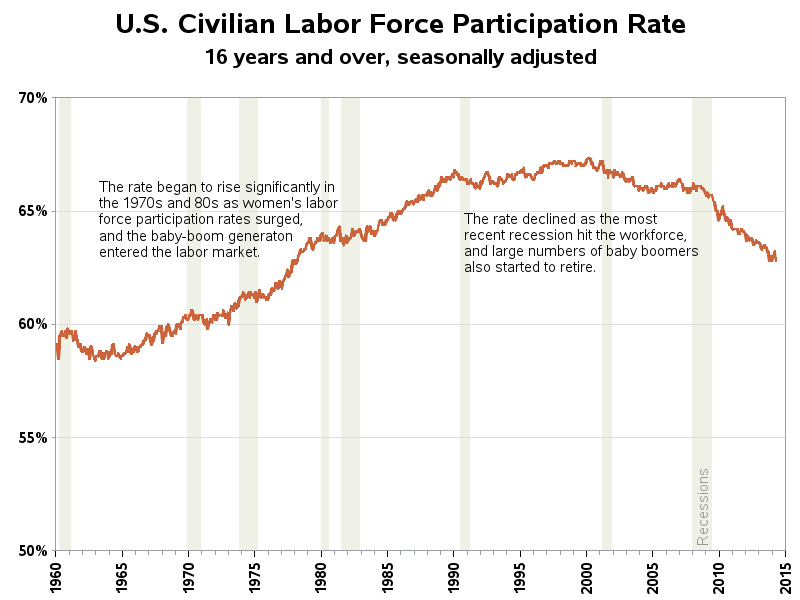
It's easy to plot events that happened at a certain time, but what about events that extended over a range of dates, such as recessions? ... This blog post teaches you a nice trick to use for that! Let's say you have a plot of the labor force participation rate