Fun with ODS Graphics: Eclipse animation (part 2)
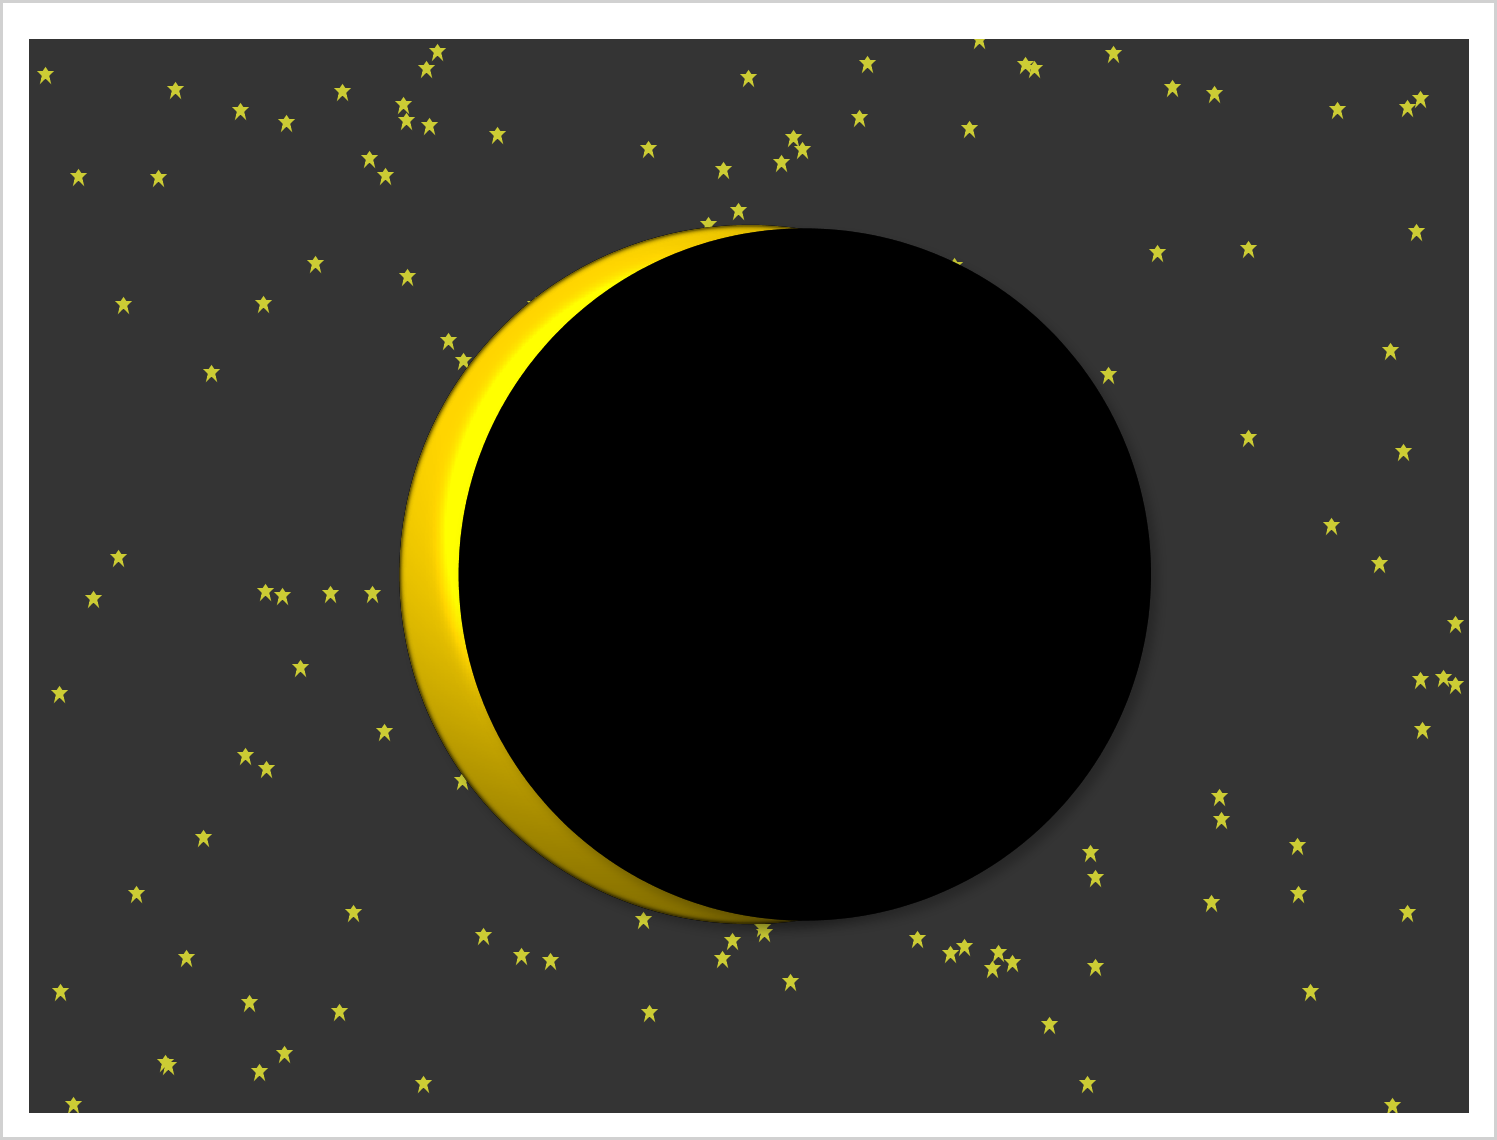
This example shows how to create two coordinated range attribute maps and use them in creating an animated gif of the eclipse.

This example shows how to create two coordinated range attribute maps and use them in creating an animated gif of the eclipse.

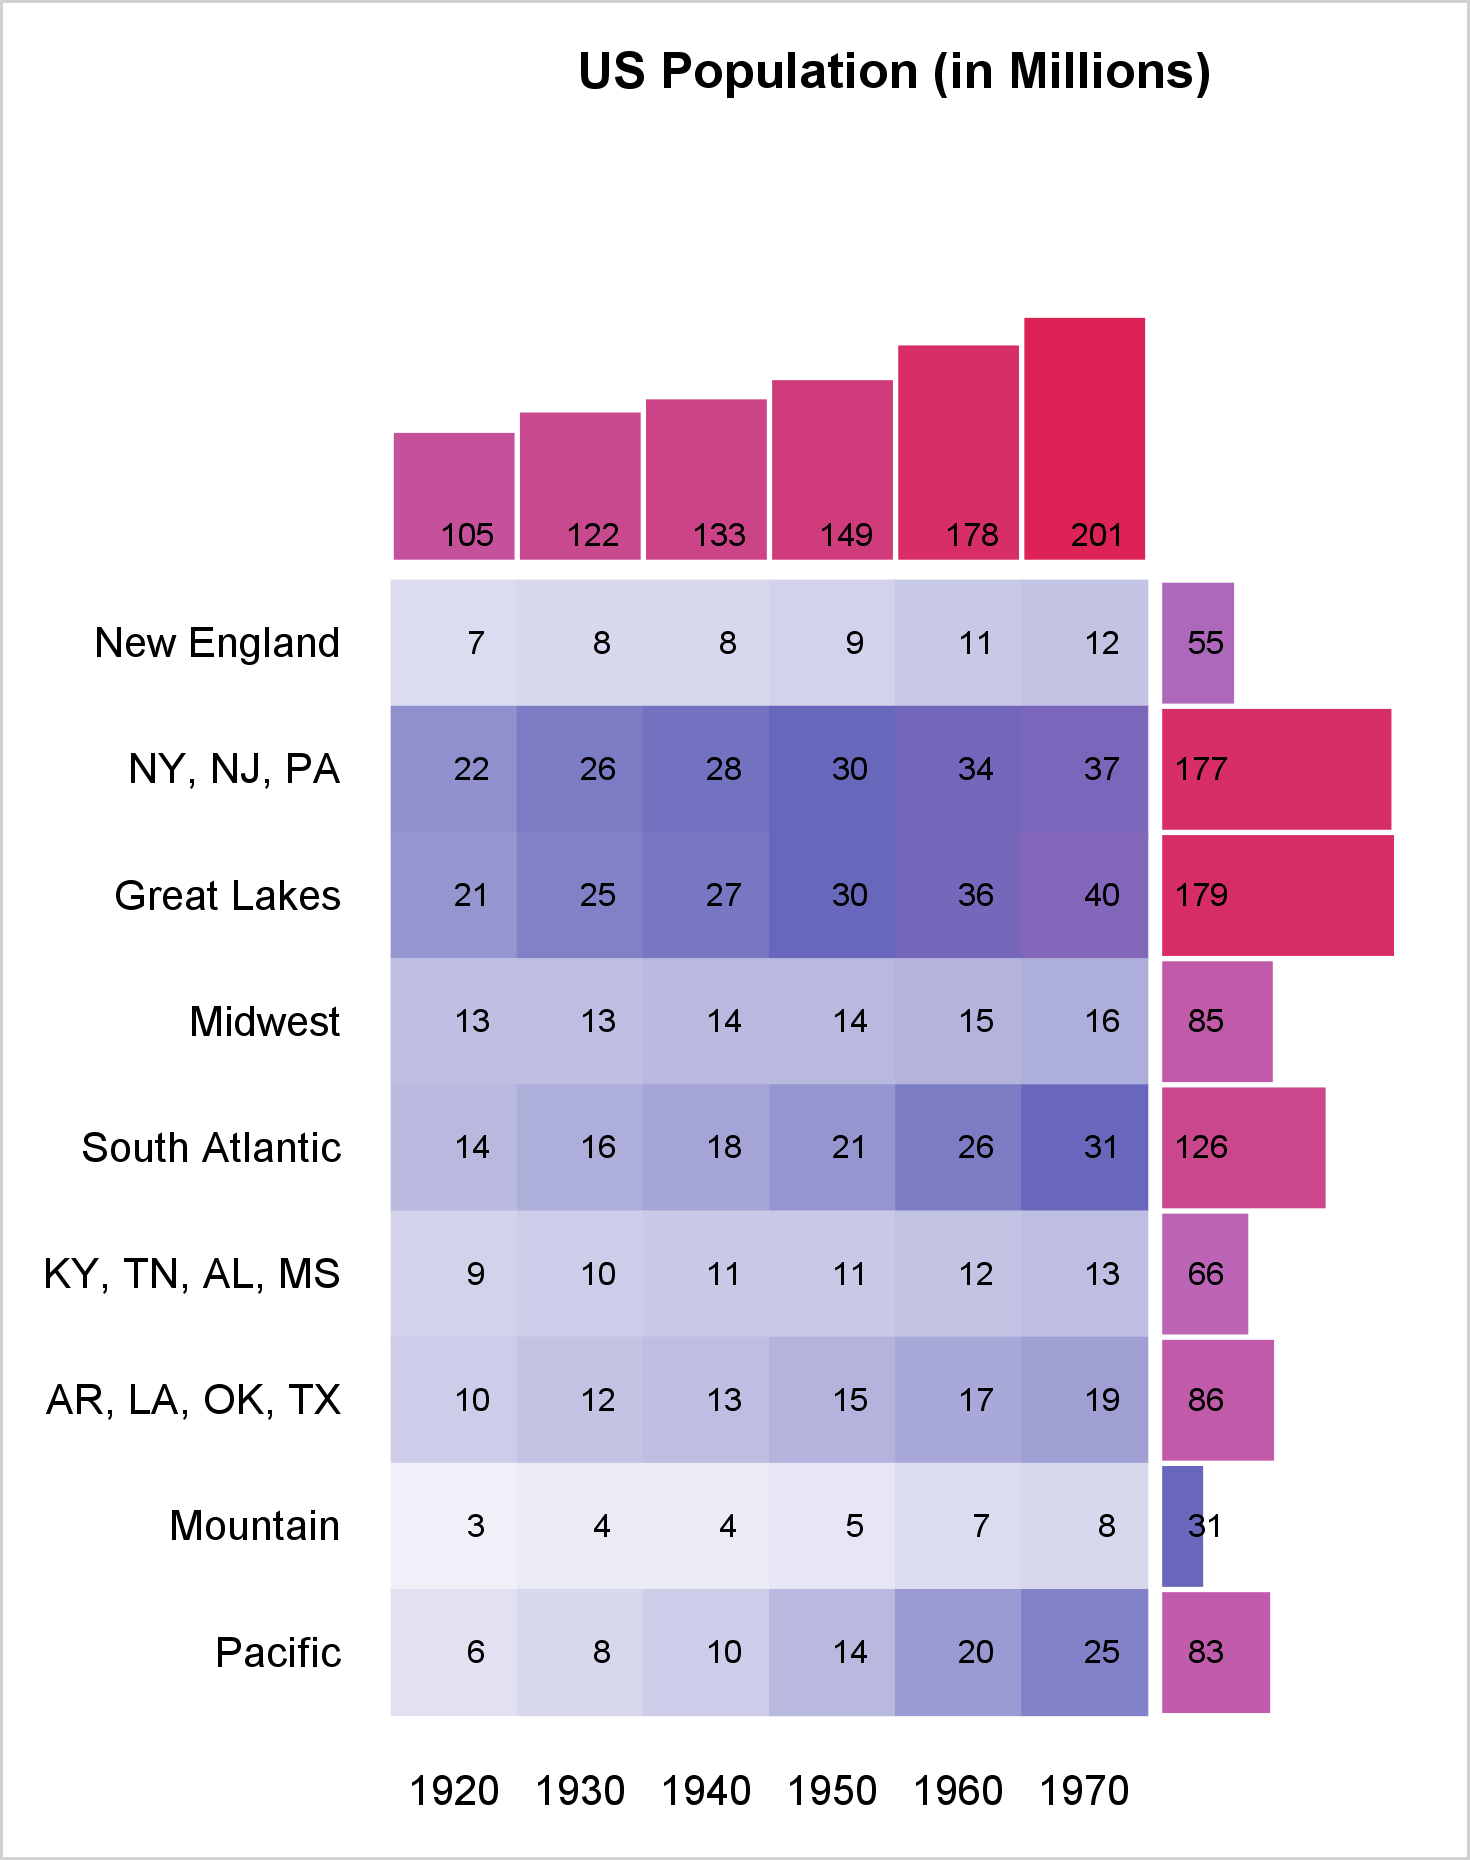
You can use a range attribute map to control the mapping of values in a continuous variable to colors. This post shows you how to use PROC SGPLOT to display multiple plots in the same graph and use range attribute maps.
In the previous two articles we discussed Discrete Attribute Maps, and how these can be used to ensure that group attributes like color are consistently mapped to group values regardless of their position in the data. Now, let us take a look at the attributes map that allows you to