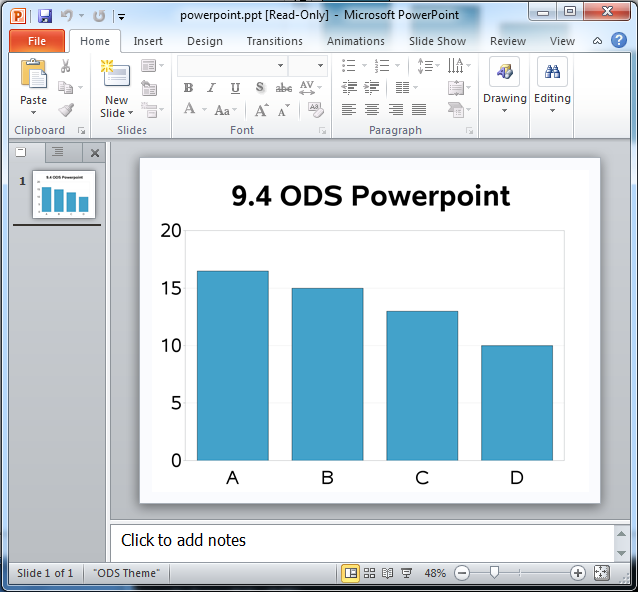
From within PowerPoint, you can use the SAS menu available through SAS for Microsoft 365, to access SAS Visual Analytics reports' graphical visuals.
I'm currently working on a large project for a SAS customer. The project comprises many activities and phases, so there is a need to track progress on many different levels. During a recent meeting the project manager announced, "I'm putting together a status deck, and I'll include some Harvey Balls
To say that I'm excited about the SAS 9.4 release is an understatement! For example, did you know that in SAS 9.4, you can write SAS/Graph output directly to a Powerpoint slide?!? This is definitely an item that was on my "wish list," and will no doubt make life a