Visualizing a flight path with weather data in SAS

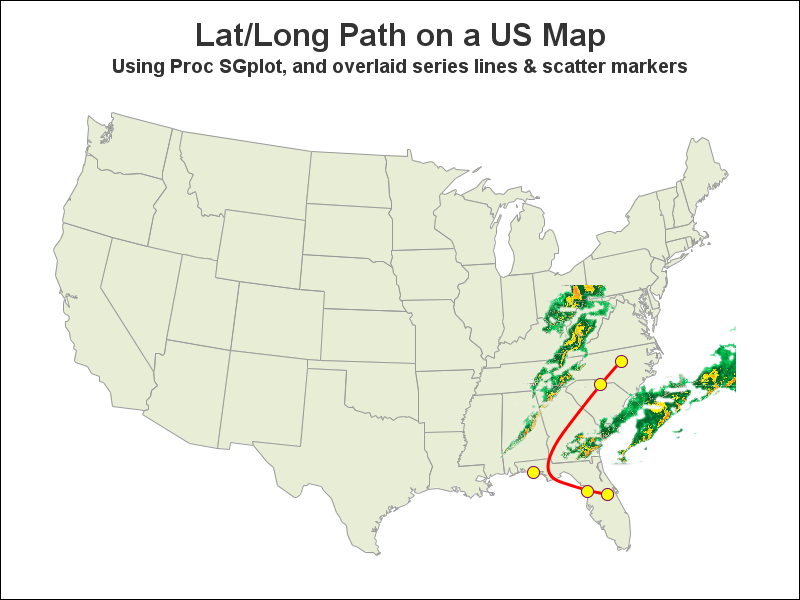
In his recent blog article on Drawing Paths on a Map using SGPLOT, Robert Allison showed us visually the path computed by the captain of his return flight from Orlando. As usual, one can rely on Robert to put in visual form some interesting bit of information. Thanks, Robert. I