There are many ways to add more "visual impact" to your maps. Some techniques grab the users' attention, but often don't add anything useful to the message the map is trying to convey (such as 3D tricks, or flashy/gratuitous images and infographics). I encourage you to design maps that have
Tag: nuclear
Giving your maps more visual impact!
How close are you to a nuclear plant?
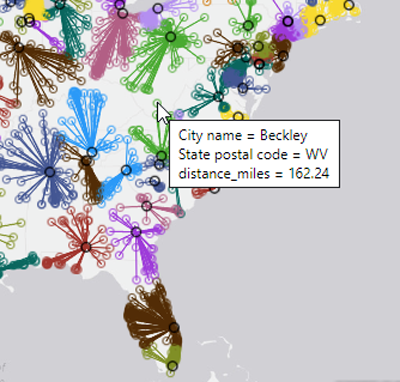
Have you ever wondered how far you live from the closest nuclear power plant? I've crunched the numbers for cities here in the US, and created an interactive SAS map to help answer that question! The average age of US nuclear power plants is 35 years, and there just doesn't
Is the US still a coal-powered nation?
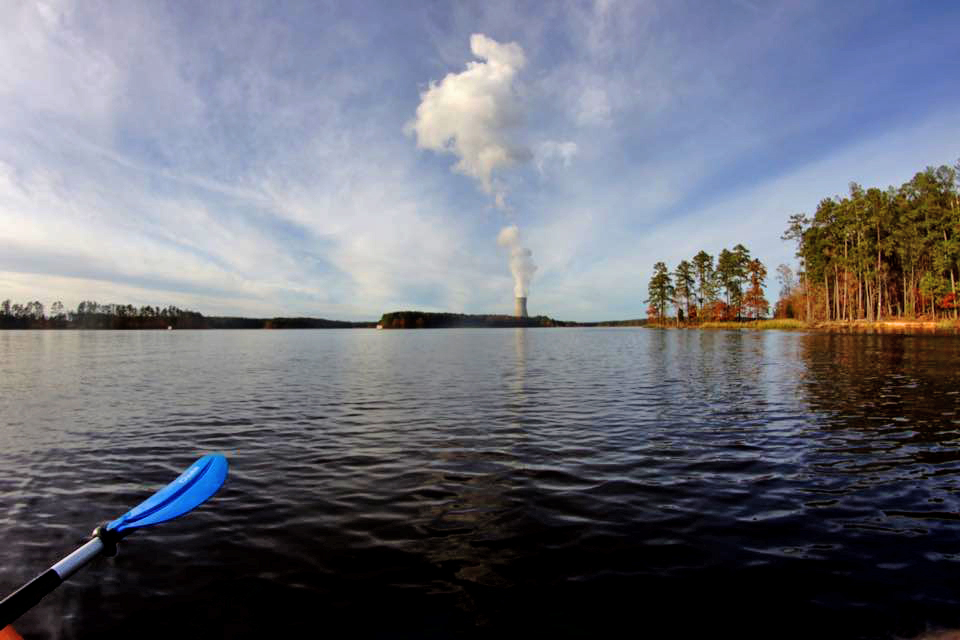
I ran across a map recently that seemed to show a lot of US states are primarily coal-powered. The map was a little difficult to read, so I decided to give it a SAS makeover ... Before we get started, here's a picture my friend David took of the Shearon Harris Nuclear Power