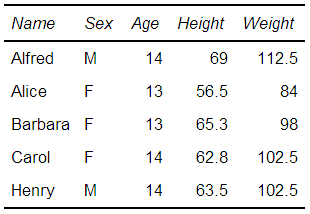
A reader posed a question in the comments to an earlier Jedi SAS Trick, asking how to write the results of a DS2 DATA _NULL_ program to a text file. It's an interesting question, as DS2 currently has no text file handling statements or capabilities. Take, for example, this traditional
Tag: New in SAS 9.4
In a previous post, I showed you how to send graphs with charttips & drilldowns in an email ... but what if you also need to send the graphs that you're drilling-down to? You guessed it - SAS also has a slick trick for doing that! When you create SAS graphs
There are 2 kinds of people in the world -- those who dread change, and those who look forward to it. Which kind of person are you, when it comes to upgrading your SAS software?!? With most software (such as Windows OS, Facebook, Gmail, etc) I tend to fall into
SAS 9.4 allows you to create html5 output with your graph inline (as part of the html), providing a great way to email your SAS/Graph output! Previously, if you used ods html and dev=png to create graphs, you had to deal with two files -- a png file (containing the graph)
ODS graph styles provide users with an easy way to control things such as the colors and fonts used in a graph, freeing the user from having to specify these properties in their code. A lot of thought was given to picking colors that work well together, and look good. The
To say that I'm excited about the SAS 9.4 release is an understatement! For example, did you know that in SAS 9.4, you can write SAS/Graph output directly to a Powerpoint slide?!? This is definitely an item that was on my "wish list," and will no doubt make life a
SAS 9.3 already has smooth (anti-aliased) lines in SAS/GRAPH device=png output, and in SAS 9.4 you will also get smooth lines in your device=gif output (and gif animations)! Woo-hoo!!! Here are a couple of simple examples to demonstrate: The first example is device=gif Proc Gmap output. If you look very closely, you'll notice that