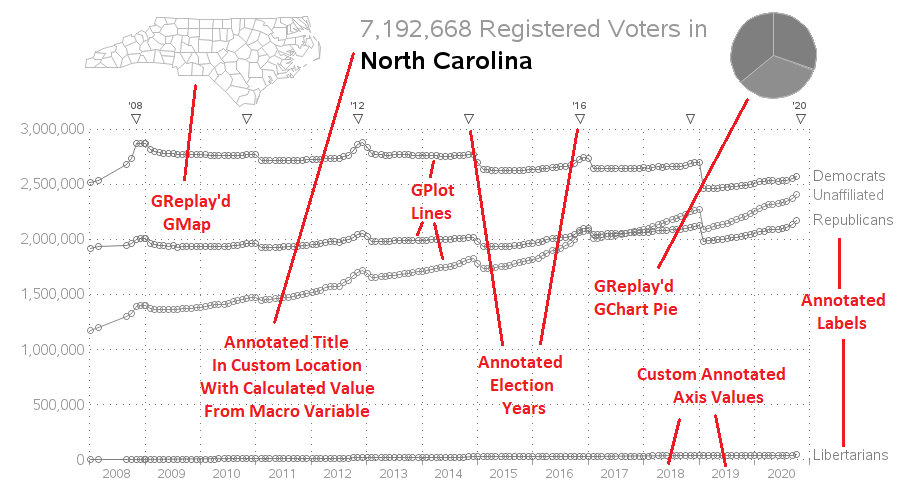
When an election is on the horizon, I always feel compelled to plot some data! And this time I'm plotting North Carolina's voter registration data! State Data For this graph, I downloaded several of the data snapshots from the NC State Board of Elections' website, and plotted a line showing
Tag: gplot
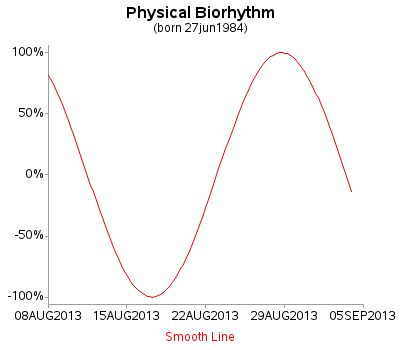
Do you know (right off the top of your head) the simple SAS/GRAPH code you would use to create line graphs? ... If not, then this tutorial is for you! A line plot is basically a scatter plot where the markers are connected. A line plot should only be used
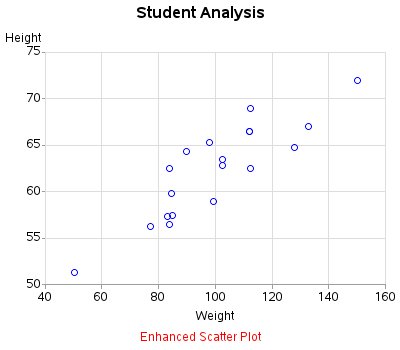
Scatter plots are probably the simplest kind of graph, and provide a great way to visually look for relationships between two variables. But, do you know (right off the top of your head) the simple SAS/GRAPH code you would use to create them? ... This tutorial leads you step-by-step through the
Have you heard the expression "Talk Turkey"? Well then, what better (tongue-in-cheek) thing to do around the Thanksgiving holiday, than talk some turkey using SAS Graphs! ;) I don't usually decorate my graphs with images and pictures (they typically make the graph more difficult to read), but when it comes