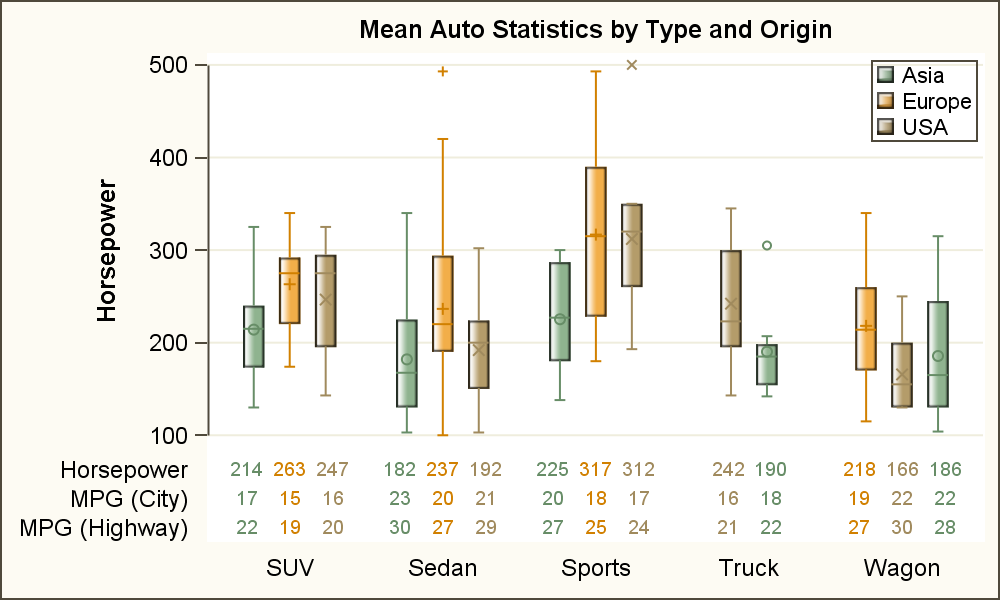
Graph Table with Class

As often is the case, this article is prompted by a recent post on the SAS/GRAPH and ODS Graphics page communities page. A user wanted to create a Graph Table showing a bar chart with tabular data for each of the category values along the x-axis. The user was creatively using