Tag: FitPolicy

Data Visualization
Sanjay Matange 0
Hotel Text

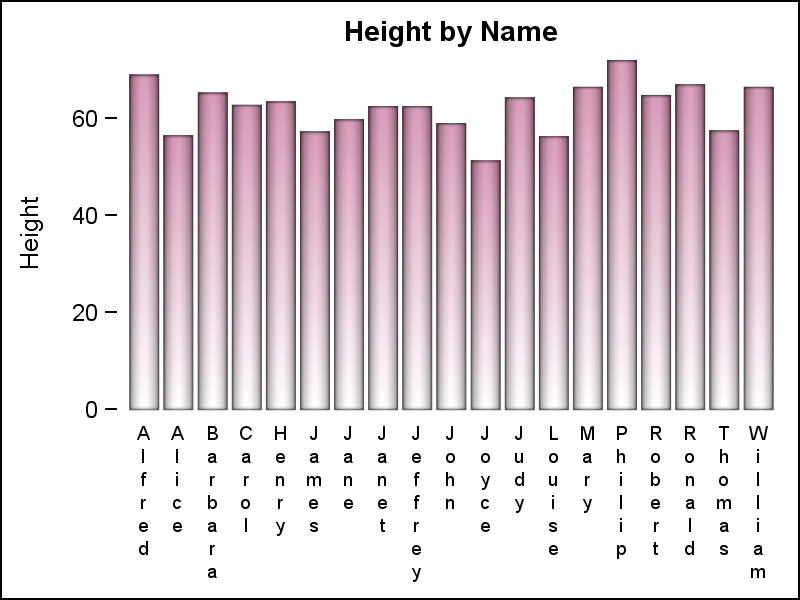
Yesterday, I published an article on Axis values display, where I mentioned the desire expressed by many users to get x-axis tick values in Hotel text orienttion.  The name comes from the way many hotel signs are displayed as shown on the right.  Such arrangement of text can also be very

Data Visualization
Sanjay Matange 0
Axis values display

Displaying nicely rendered axis values reduces clutter and makes the graph more readable.  With SAS 9.4, we added the ability for splitting x-axis tick values on white space to create a nice and readable x-axis as shown in the graph on the right. It is always a challenge to fit

Data Visualization
Sanjay Matange 0
Axis Customizations

All axis customization features are always welcome.  Especially since SGPLOT statements can often be used to create non standard graphs, having the ability to customize the axes is important.  This article presents ways in which you can customize the discrete axes. By default, the x axis will try to display the